RNA sequencing (RNA-seq) is a powerful technique for understanding cellular state and dynamics. However, comprehensive transcriptomic characterization of multiple RNA-seq datasets is laborious without bioinformatics training and skills. To remove the barriers to sequence data analysis in the research community, Kumamoto University researchers have developed “RNAseqChef” (RNA-seq data controller highlighting expression features), a web-based platform of systematic transcriptome analysis that can automatically detect, integrate, and visualize differentially expressed genes and their biological functions. To validate its versatile performance, the researchers examined the pharmacological action of sulforaphane (SFN), a natural isothiocyanate, on various types of cells and mouse tissues using multiple datasets in vitro and in vivo. Notably, SFN treatment upregulated the ATF6-mediated unfolded protein response in the liver and the NRF2-mediated antioxidant response in the skeletal muscle of diet-induced obese mice. In contrast, the commonly downregulated pathways included collagen synthesis and circadian rhythms in the tissues tested. On the server of RNAseqChef, the researchers simply evaluated and visualized all analyzing data and discovered the NRF2-independent action of SFN. Collectively, RNAseqChef provides an easy-to-use open resource that identifies context-dependent transcriptomic features and standardizes data assessment.
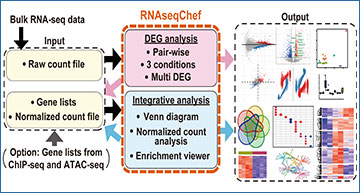
Overview of RNAseqChef (RNA-seq data controller highlighting gene expression feature)
A, RNAseqChef is a web-based platform of systematic transcriptome analysis and can automatically detect, integrate, and visualize the DEGs and their biological functions, by uploading the raw count files of interest. The “DEG Analysis Unit” consists of “Pair-wise DEG”, “3 conditions DEG”, and “Multi DEG”. The “Integrative Analysis Unit” then consists of “Venn diagram,” “Normalized count analysis,” and “Enrichment viewer.” The result files obtained from the DEG Analysis Unit can be used as input files for the Integrative Analysis Unit, which makes it easy to perform the bioinformatic studies on demand. B, analysis of the common and cell/tissue-specific effects of SFN on transcriptome using RNAseqChef. DEG, differentially expressed gene; SFN, Sulforaphane.
Availability – https://imeg-ku.shinyapps.io/RNAseqChef/
Etoh K, Nakao M. (2023) A web-based integrative transcriptome analysis, RNAseqChef, uncovers the cell/tissue type-dependent action of sulforaphane. J Biol Chem 299(6):104810. [article]


