

Single-cell RNA sequencing (scRNA-seq) offers a high-resolution molecular view into complex tissues, but suffers from high levels of technical noise which frustrates efforts to compare the gene expression programs of different cell types. “Spike-in” RNA standards help control for technical variation in scRNA-seq, but using them with recently developed, ultra-scalable scRNA-seq methods based on combinatorial indexing is not feasible.
Researchers at the University of Washington have developed a simple and cost-effective method for normalizing transcript counts and subtracting technical variability that improves differential expression analysis in scRNA-seq. The method affixes a ladder of synthetic single-stranded DNA oligos to each cell that appears in its RNA-seq library. With improved normalization we explore chemical perturbations with broad or highly specific effects on gene regulation, including RNA pol II elongation, histone deacetylation, and activation of the glucocorticoid receptor. These methods reveal that inhibiting histone deacetylation prevents cells from executing their canonical program of changes following glucocorticoid stimulation.
A set of hash oligos can be captured within nuclei
and serve as external standards in sci-RNA-seq experiments
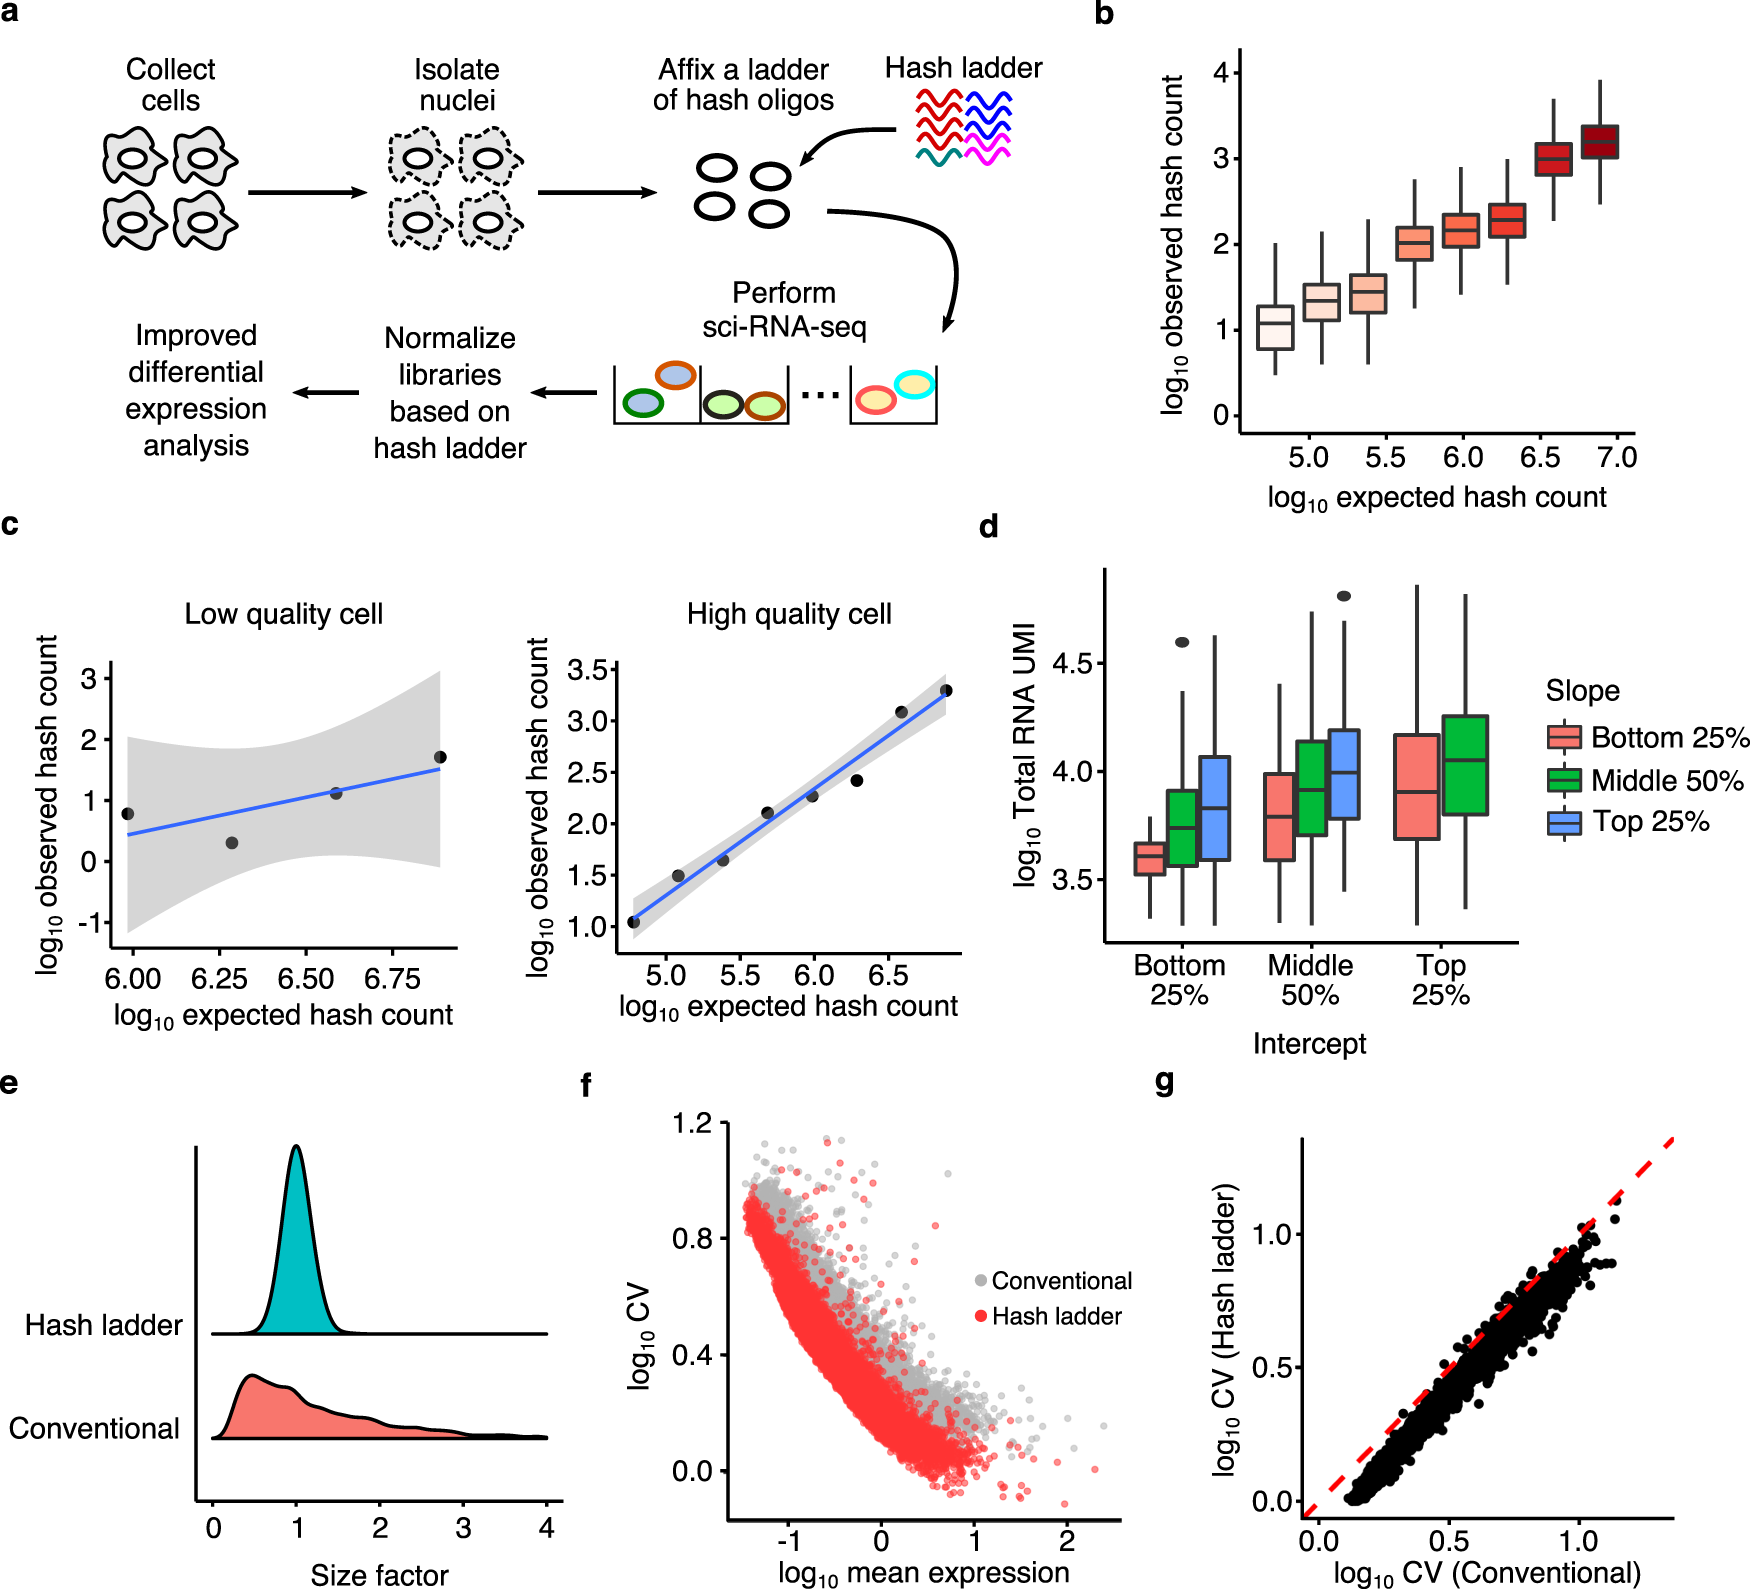
a An experimental overview of the hash ladder method. Nuclei are isolated from cells, fixed with a ladder of hash oligos, then processed with sci-RNA-seq. b Boxplot of hash oligo UMI counts per cell, each hash oligo spiked in at different abundance (n = 1884 cells). c Scatter plot of expected and observed hash ladder UMI counts, demonstrating a cell with low (left) and high (right) hash capture efficiency. d Boxplot of total RNA count of cells grouped according to the intercept and slope of their hash ladder calibration line (n = 1884 cells). e Distribution of cell-specific size factors computed using the conventional and hash ladder methods. f Scatter plot of normalized average expression and coefficient of variation (CV) of expressed genes in HEK293T. g Comparison of CV values computed with the conventional and hash ladder-based normalization methods. The centerline of the boxplots in b and d indicates the median, the box displays the first and third quartile, and the whiskers show the 1.5 interquartile range (IQR). Outliers are displayed as points.
Kim HJ, Booth G, Saunders L, Srivatsan S, McFaline-Figueroa JL, Trapnell C. (2022) Nuclear oligo hashing improves differential analysis of single-cell RNA-seq. Nat Commun 13(1):2666. [article]


