One of the standard methods of high-throughput RNA sequencing analysis is differential expression. However, it does not detect changes in molecular regulation. In contrast to the standard differential expression analysis, differential co-expression one aims to detect pairs or clusters whose mutual expression changes between two conditions.
HSE University researchers have developed Differential Co-expression Network Analysis (DCoNA)-an open-source statistical tool that allows one to identify pair interactions, which correlation significantly changes between two conditions. Comparing DCoNA with the state-of-the-art analog, we showed that DCoNA is a faster, more accurate and less memory-consuming tool. The researchers applied DCoNA to prostate mRNA/miRNA-seq data collected from The Cancer Genome Atlas (TCGA) and compared predicted regulatory interactions of miRNA isoforms (isomiRs) and their target mRNAs between normal and cancer samples. As a result, almost all highly expressed isomiRs lost negative correlation with their targets in prostate cancer samples compared to ones without the pathology. One exception to this trend was the canonical isomiR of hsa-miR-93-5p acquiring cancer-specific targets. Further analysis showed that cancer aggressiveness simultaneously increased with the expression level of this isomiR in both TCGA primary tumor samples and 153 blood plasma samples of P. Hertsen Moscow Oncology Research Institute patients’ cohort analyzed by miRNA microarrays.
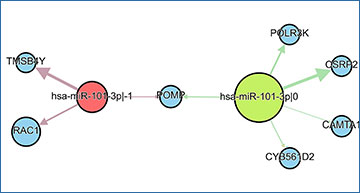
(A) Two isomiRs of hsa-miR-101-3p have different seed regions (2–7 nts) highlighted red and green. (B) These isomiRs potentially regulate different genes in prostate cancer. The width of edges represents an absolute value of Spearman correlation between an isomiR and its target expression levels. All correlations are <−0.3. The size of the nodes corresponds to the expression in ‘Normal’ samples
Availability – Source code and documentation of DCoNA are available at: https://github.com/zhiyanov/DCoNA.
Zhiyanov A, Engibaryan N, Nersisyan S, Shkurnikov M, Tonevitsky A. (2023) Differential co-expression network analysis with DCoNA reveals isomiR targeting aberrations in prostate cancer. Bioinformatics 39(2):btad051. [article]


