

Understanding how genes behave over time is crucial for unlocking the secrets of development, disease progression, and more. Researchers have long grappled with the challenge of analyzing gene expression patterns at the single-cell level, where cells can exhibit complex and dynamic behaviors. Now, a new statistical method developed by researchers at Xi’an Jiaotong University called TDEseq is poised to revolutionize the way we study temporal gene expression dynamics in single-cell RNA sequencing (scRNA-seq) studies.
TDEseq stands for Temporal Dynamics of Expression Sequencing, and it’s not just another statistical tool—it’s a powerful approach that harnesses the full potential of smoothing splines basis functions and hierarchical structure linear additive mixed models. But what does that mean?
Let’s break it down:
1. Smoothing Splines Basis Functions: Think of these as mathematical tools that help smooth out noisy data. In scRNA-seq studies, where gene expression measurements can be noisy and erratic, smoothing splines provide a way to clean up the data and reveal underlying trends more clearly.
2. Hierarchical Structure Linear Additive Mixed Models: This mouthful of a term essentially refers to a sophisticated statistical framework that accounts for the fact that cells within an individual organism are not independent of each other. In other words, it recognizes that cells within the same organism share certain characteristics or behaviors due to their common origin.
Now, let’s put it all together:
TDEseq utilizes these advanced statistical techniques to analyze scRNA-seq data in a way that captures the dynamic nature of gene expression over time. By accounting for the interdependence of multiple time points and the correlated nature of cells within individuals, TDEseq is able to identify four distinct temporal expression patterns within specific cell types.
Schematic overview of TDEseq and the methods comparison in simulations
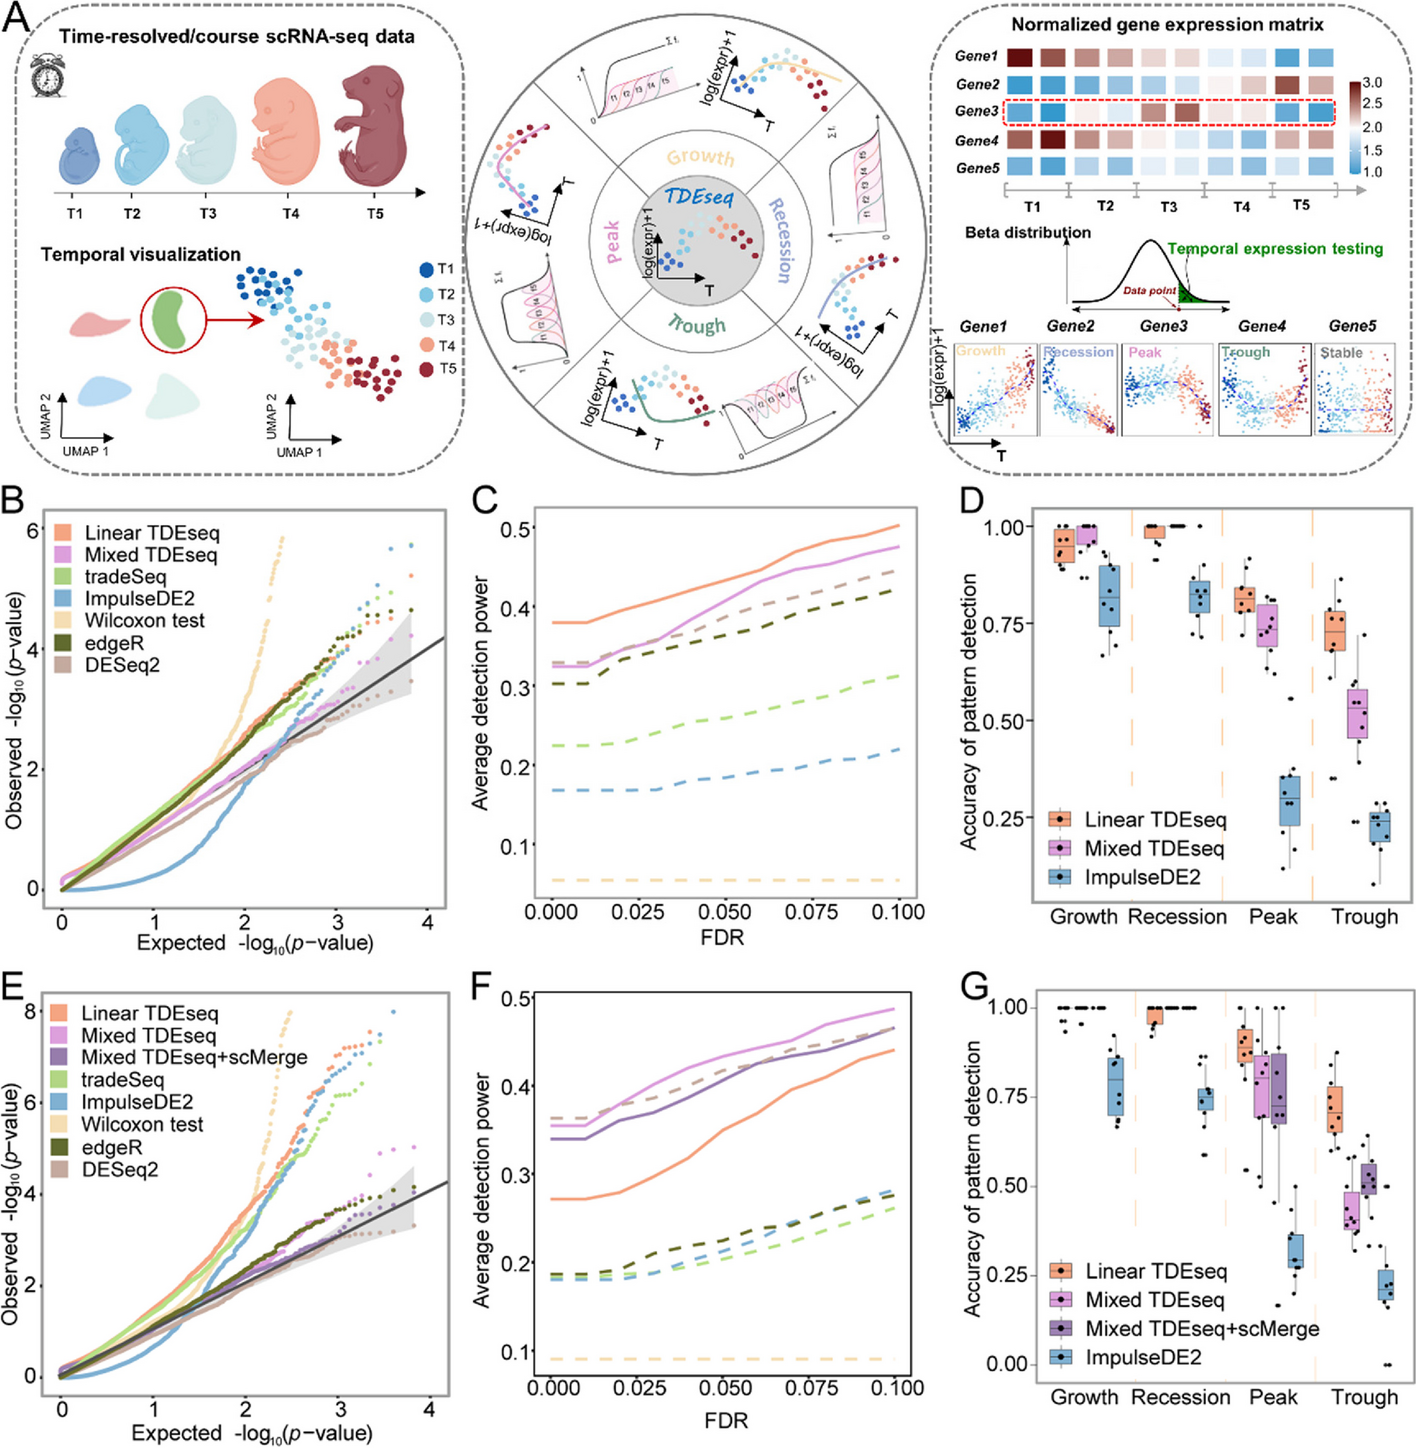
A TDEseq is designed to perform temporal expression gene analysis of time-course scRNA-seq data. With a given gene, TDEseq determines one of four temporal expression patterns, i.e., growth, recession, peak, and trough. TDEseq combines the four p-values using the Cauchy combination rule as a final p-value, facilitating the detection of temporal gene expression patterns. B The quantile–quantile (QQ) plot shows the type I error control under the baseline parameter settings. The well-calibrated p-values will be expected laid on the diagonal line. The p-values generated from Mixed TDEseq (plum) and DESeq2 (brown) are reasonably well-calibrated, while Linear TDEseq (orange), tradeSeq (green), ImpulseDE2 (blue), Wilcoxon test (yellow) and edgeR (dark green) produced the p-values that are not well-calibrated. C The average power of 10 simulation replicates for temporal expression gene detection across a range of FDR cutoffs under the baseline parameter settings. Both versions of TDEseq exhibit high detection power of temporal expression genes, followed by DESeq2, edgeR, tradeSeq, and ImpulseDE2. Wilcoxon test does not fare well, presumably due to bias towards highly expressed genes. The TDEseq methods were highlighted using solid lines, while other methods were represented by dashed lines in the plots. D The comparison of Linear TDEseq, Mixed TDEseq, and ImpuseDE2 in terms of the accuracy of temporal expression pattern detection under the baseline parameter settings, at an FDR of 5%. The temporal expression genes detected by TDEseq demonstrated a higher accuracy than those detected by ImpluseDE2. E The quantile–quantile (QQ) plot shows the type I error control under the large batch effect parameter settings. The p-values generated from Mixed TDEseq coupled with scMerge (purple) and DESeq2 (brown) are reasonably well-calibrated, while Linear TDEseq (orange), Mixed TDEseq (plum), tradeSeq (green), ImpulseDE2 (blue), Wilcoxon test (yellow), and edgeR (dark green) generated the inflated p-values. F The average power of 10 simulation replicates the comparison of temporal expression gene detection across a range of FDR cutoffs under the large batch effect parameter settings. G The comparison of Linear TDEseq, Mixed TDEseq, and Mixed TDEseq coupled with scMerge and ImpuseDE2 in terms of the accuracy of temporal expression pattern detection under the large batch effect parameter settings, at an FDR of 5%. Since DESeq2, edgeR, tradeSeq, and Wilcoxon tests were not originally designed for pattern-specific detection we excluded them in the comparison. FDR denotes the false discovery rate
But how do we know if TDEseq actually works?
Extensive simulation studies and analysis of real scRNA-seq datasets have demonstrated the effectiveness of TDEseq. Not only does it produce well-calibrated p-values (a measure of statistical significance), but it also boasts up to a 20% increase in power compared to existing methods for detecting temporal gene expression patterns. In simpler terms, it’s better at finding meaningful patterns in the data, even when those patterns are subtle or elusive.
So, why is this important?
Understanding how gene expression changes over time is crucial for unraveling the mysteries of biology, from how organisms develop to how diseases progress. By providing researchers with a powerful tool to analyze temporal gene expression dynamics at the single-cell level, TDEseq opens up new avenues of exploration and discovery.
In conclusion, TDEseq represents a significant advancement in the field of single-cell RNA sequencing analysis. With its ability to uncover hidden patterns in gene expression data, TDEseq promises to deepen our understanding of the complex processes that govern life itself.
Fan Y, Li L, Sun S. (2024) Powerful and accurate detection of temporal gene expression patterns from multi-sample multi-stage single-cell transcriptomics data with TDEseq. Genome Biol 25(1):96. [article]


