

Emerging spatial technologies, including spatial transcriptomics and spatial epigenomics, are becoming powerful tools for profiling of cellular states in the tissue context1-5. However, current methods capture only one layer of omics information at a time, precluding the possibility of examining the mechanistic relationship across the central dogma of molecular biology.
Researchers at Yale University have developed two technologies for spatially resolved, genome-wide, joint profiling of the epigenome and transcriptome by cosequencing chromatin accessibility and gene expression, or histone modifications (H3K27me3, H3K27ac or H3K4me3) and gene expression on the same tissue section at near-single-cell resolution. These were applied to embryonic and juvenile mouse brain, as well as adult human brain, to map how epigenetic mechanisms control transcriptional phenotype and cell dynamics in tissue. Although highly concordant tissue features were identified by either spatial epigenome or spatial transcriptome the researchers also observed distinct patterns, suggesting their differential roles in defining cell states. Linking epigenome to transcriptome pixel by pixel allows the uncovering of new insights in spatial epigenetic priming, differentiation and gene regulation within the tissue architecture. These technologies are of great interest in life science and biomedical research.
Design and evaluation of spatial epigenome–transcriptome
cosequencing with E13 mouse embryo
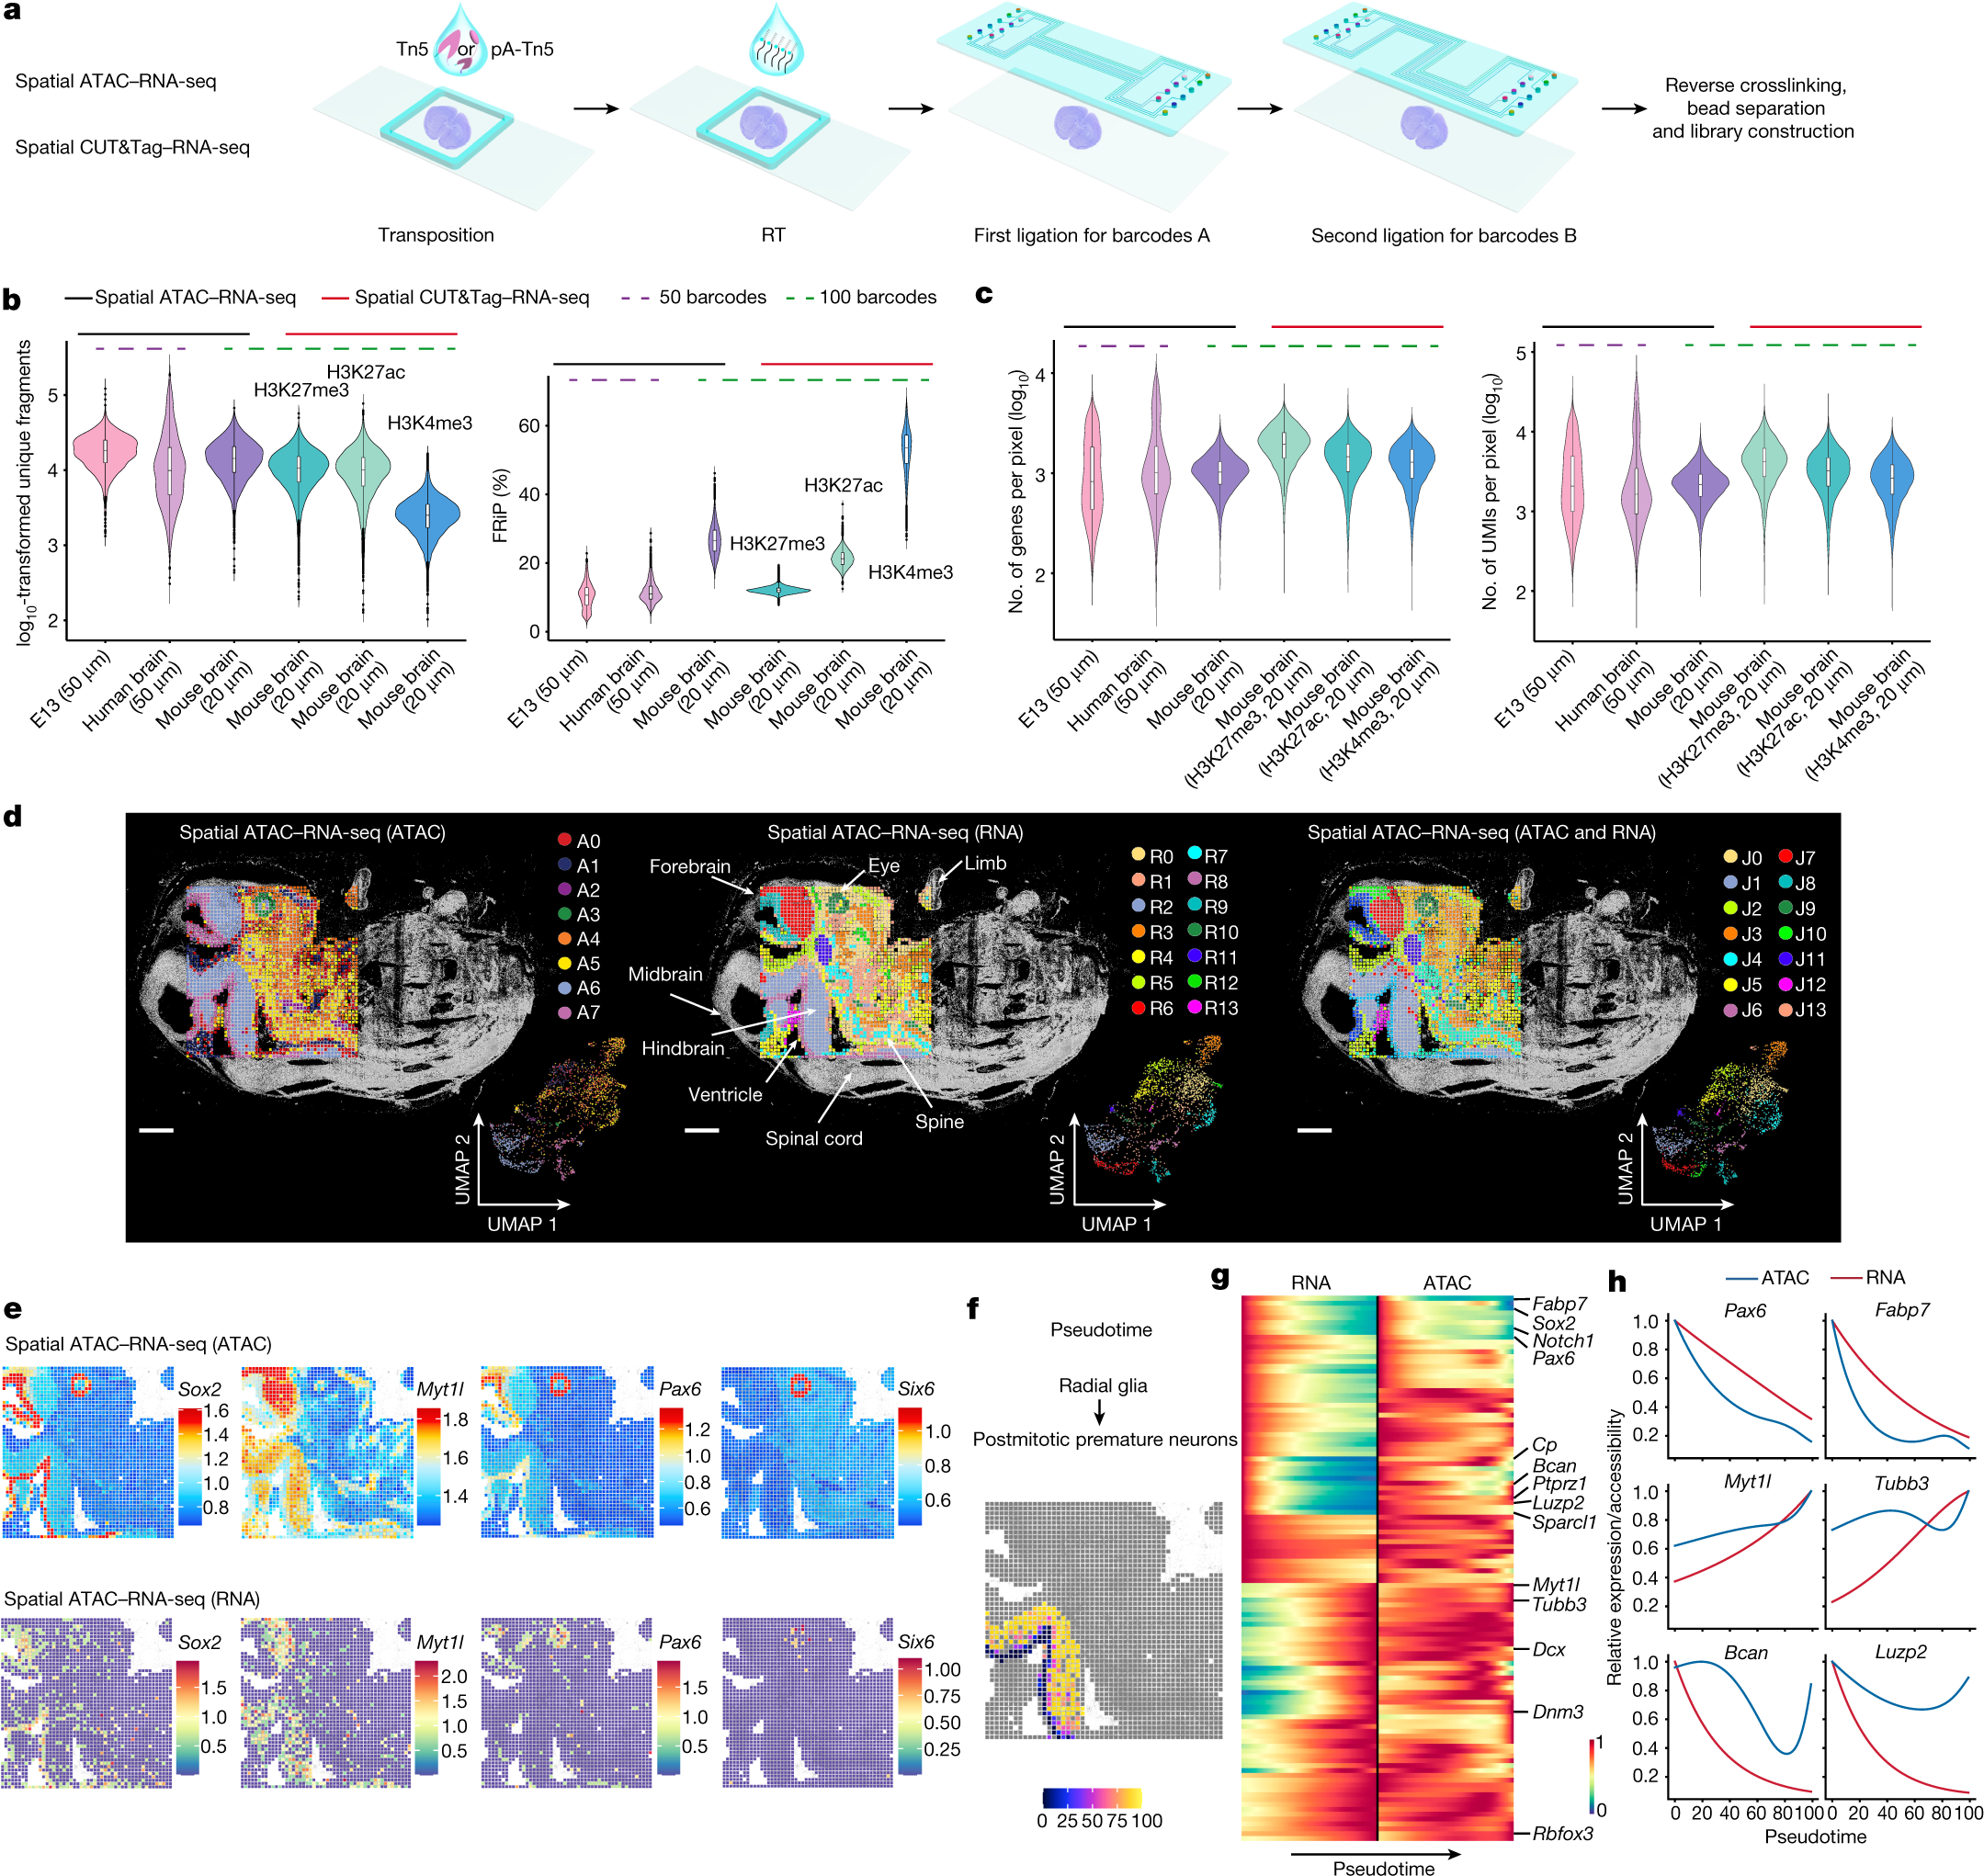
a, Schematic workflow. b, Comparison of number of unique fragments and fraction of reads in peaks (FRiP) in spatial ATAC–RNA-seq and spatial CUT&Tag–RNA-seq. c, Gene and UMI count distribution in spatial ATAC–RNA-seq and spatial CUT&Tag–RNA-seq. Number of pixels in E13, 2,187; in human brain, 2,500; in mouse brain (ATAC), 9,215; in mouse brain (H3K27me3), 9,752; in mouse brain (H3K27ac), 9,370; in mouse brain (H3K4me3), 9,548. Box plots show the median (centre line), the first and third quartiles (box limits) and 1.5× interquartile range (whiskers). d, Spatial distribution and UMAP of all clusters for ATAC, RNA and joint clustering of ATAC and RNA data. Overlay of clusters with the tissue image shows that spatial clusters precisely match anatomic regions. Pixel size, 50 µm; scale bars, 1 mm. e, Spatial mapping of GAS and gene expression for selected marker genes in different clusters for ATAC and RNA in spatial ATAC–RNA-seq. f, Pseudotime analysis from radial glia to postmitotic premature neurons visualized at the spatial level. g, Heatmaps delineating gene expression and GAS for marker genes. h, Dynamic changes in GAS and gene expression across pseudotime.
Zhang D, Deng Y, Kukanja P, Agirre E, Bartosovic M, Dong M, Ma C, Ma S, Su G, Bao S, Liu Y, Xiao Y, Rosoklija GB, Dwork AJ, Mann JJ, Leong KW, Boldrini M, Wang L, Haeussler M, Raphael BJ, Kluger Y, Castelo-Branco G, Fan R. (2023) Spatial epigenome-transcriptome co-profiling of mammalian tissues. Nature [Epub ahead of print]. [article]


