

Cellular function in tissue is dependent on the local environment, requiring new methods for spatial mapping of biomolecules and cells in the tissue context. The emergence of spatial transcriptomics has enabled genome-scale gene expression mapping, but the ability to capture spatial epigenetic information of tissue at the cellular level and genome scale is lacking.
A team led by researchers at Yale University has now developed a method for spatially resolved chromatin accessibility profiling of tissue sections using next-generation sequencing (spatial-ATAC-seq) by combining in situ Tn5 transposition chemistry and microfluidic deterministic barcoding.
Spatial-ATAC-seq design, workflow and data quality
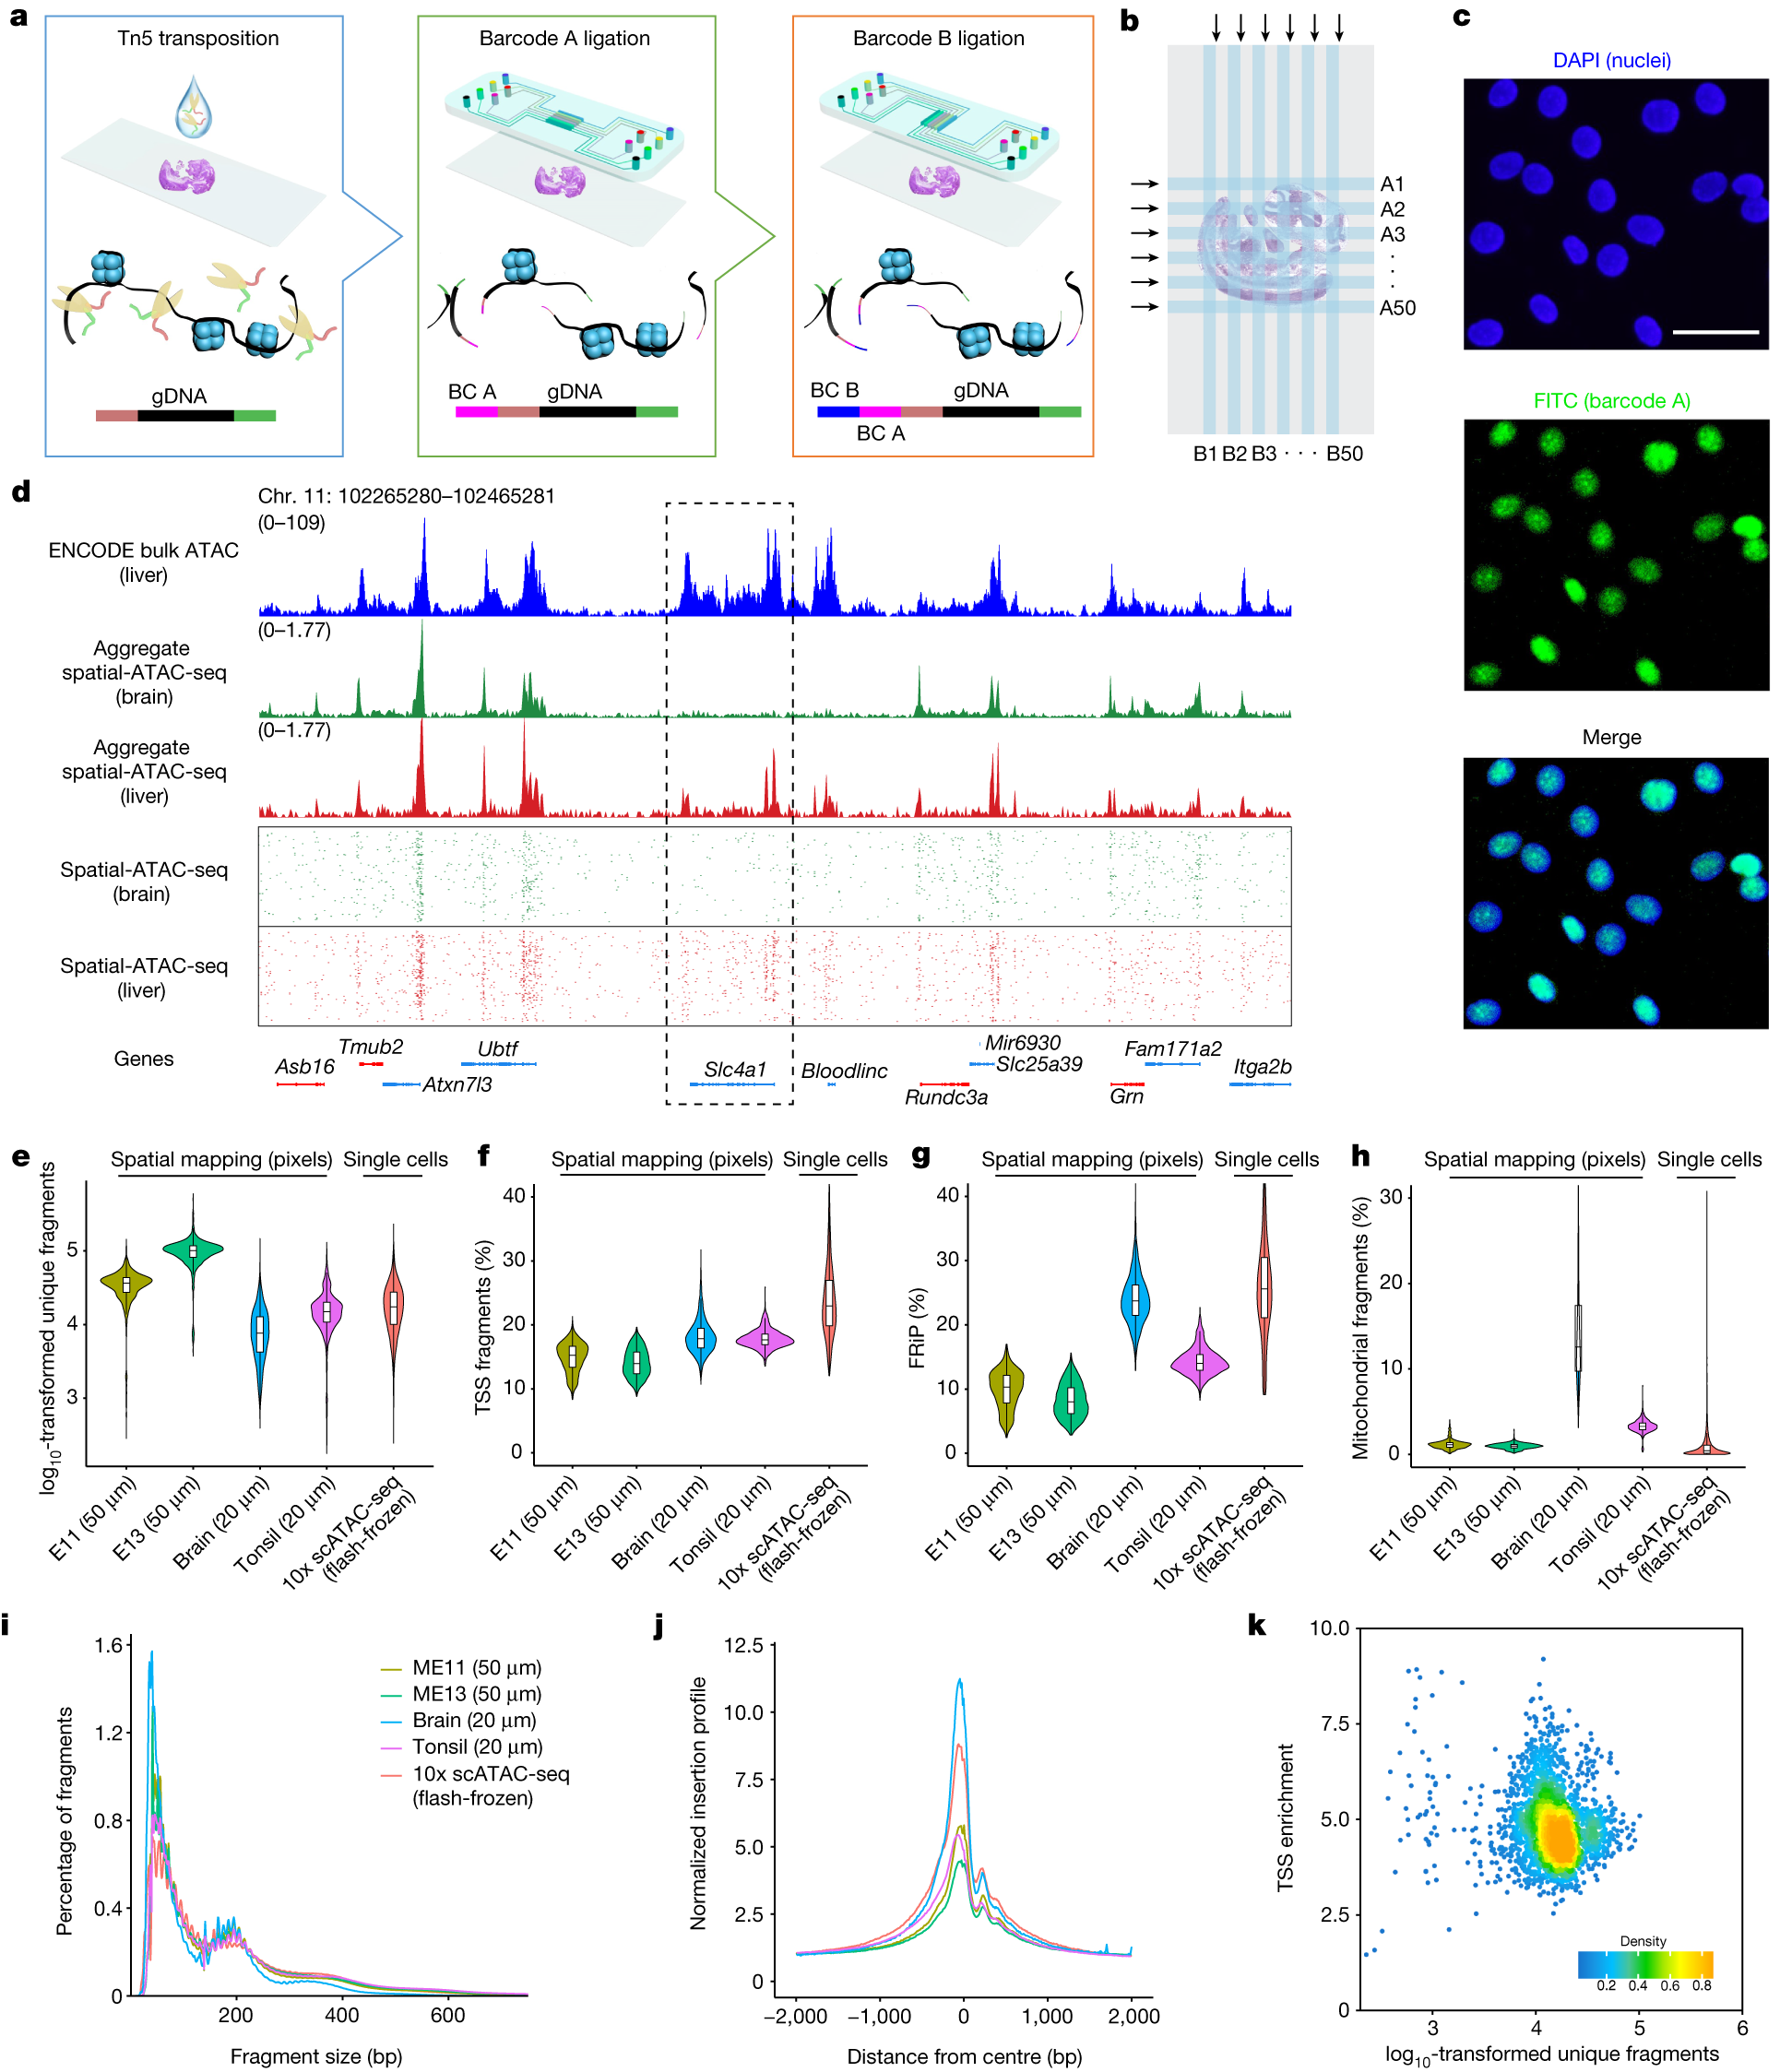
a, Schematic workflow. Tn5 transposition was performed in tissue sections, followed by in situ ligation of two sets of DNA barcodes (A1–A50, B1–B50). b, Microfluidic crossflow scheme. c, Validation of in situ transposition and ligation using fluorescent DNA probes. Tn5 transposition was performed in 3T3 cells on a glass slide stained with DAPI (blue). Next, FITC-labelled barcode A was ligated to the adapters on the transposase-accessible genomic DNA. Scale bar, 50 µm. d, Aggregate spatial chromatin accessibility profiles recapitulated published profiles of ATAC-seq in the liver of E13 mouse embryos. e, Comparison of the number of unique fragments between spatial-ATAC-seq and 10x scATAC-seq. f, Comparison of the fraction of TSS fragments between spatial-ATAC-seq and 10x scATAC-seq. g, Comparison of the fraction of mitochondrial fragments between spatial-ATAC-seq and 10x scATAC-seq. h, Comparison of the fraction of reads in peaks (FRiP) between spatial-ATAC-seq and 10x scATAC-seq. The number of pixels/cells in E11: 2,162; E13: 2,275; brain: 2,500; tonsil: 2,488; scATAC-seq: 3,789. The box plots show the median (centre line), the first and third quartiles (box limits), and 1.5× the interquartile range (whiskers). i, Comparison of the insert size distribution of ATAC-seq fragments between spatial-ATAC-seq and 10x scATAC-seq. j, Comparison of the enrichment of ATAC-seq reads around TSSs between spatial-ATAC-seq and 10x scATAC-seq. Colouring is consistent with i. k, The TSS enrichment score versus unique nuclear fragments per cell in human tonsils.
Profiling mouse embryos using spatial-ATAC-seq delineated tissue-region-specific epigenetic landscapes and identified gene regulators involved in the development of the central nervous system. Mapping the accessible genome in the mouse and human brain revealed the intricate arealization of brain regions. Applying spatial-ATAC-seq to tonsil tissue resolved the spatially distinct organization of immune cell types and states in lymphoid follicles and extrafollicular zones. This technology progresses spatial biology by enabling spatially resolved chromatin accessibility profiling to improve our understanding of cell identity, cell state and cell fate decision in relation to epigenetic underpinnings in development and disease.
Deng Y, Bartosovic M, Ma S, Zhang D, Kukanja P, Xiao Y, Su G, Liu Y, Qin X, Rosoklija GB, Dwork AJ, Mann JJ, Xu ML, Halene S, Craft JE, Leong KW, Boldrini M, Castelo-Branco G, Fan R. (2022) Spatial profiling of chromatin accessibility in mouse and human tissues. Nature [Epub ahead of print]. [article]


