

CRISPR screens with single-cell transcriptomic readouts are a valuable tool to understand the effect of genetic perturbations including single nucleotide variants (SNVs) associated with diseases. Interpretation of these data is currently limited as genotypes cannot be accurately inferred from guide RNA identity alone. Researchers at the Wellcome Sanger Institute have developed scSNV-seq which overcomes this limitation by coupling single-cell genotyping and transcriptomics of the same cells enabling accurate and high-throughput screening of SNVs. Analysis of variants across the JAK1 gene with scSNV-seq demonstrates the importance of determining the precise genetic perturbation and accurately classifies clinically observed missense variants into three functional categories: benign, loss of function, and separation of function.
A single-cell base editor screen tiling across JAK1 is improved
by coupling genotype with transcriptome
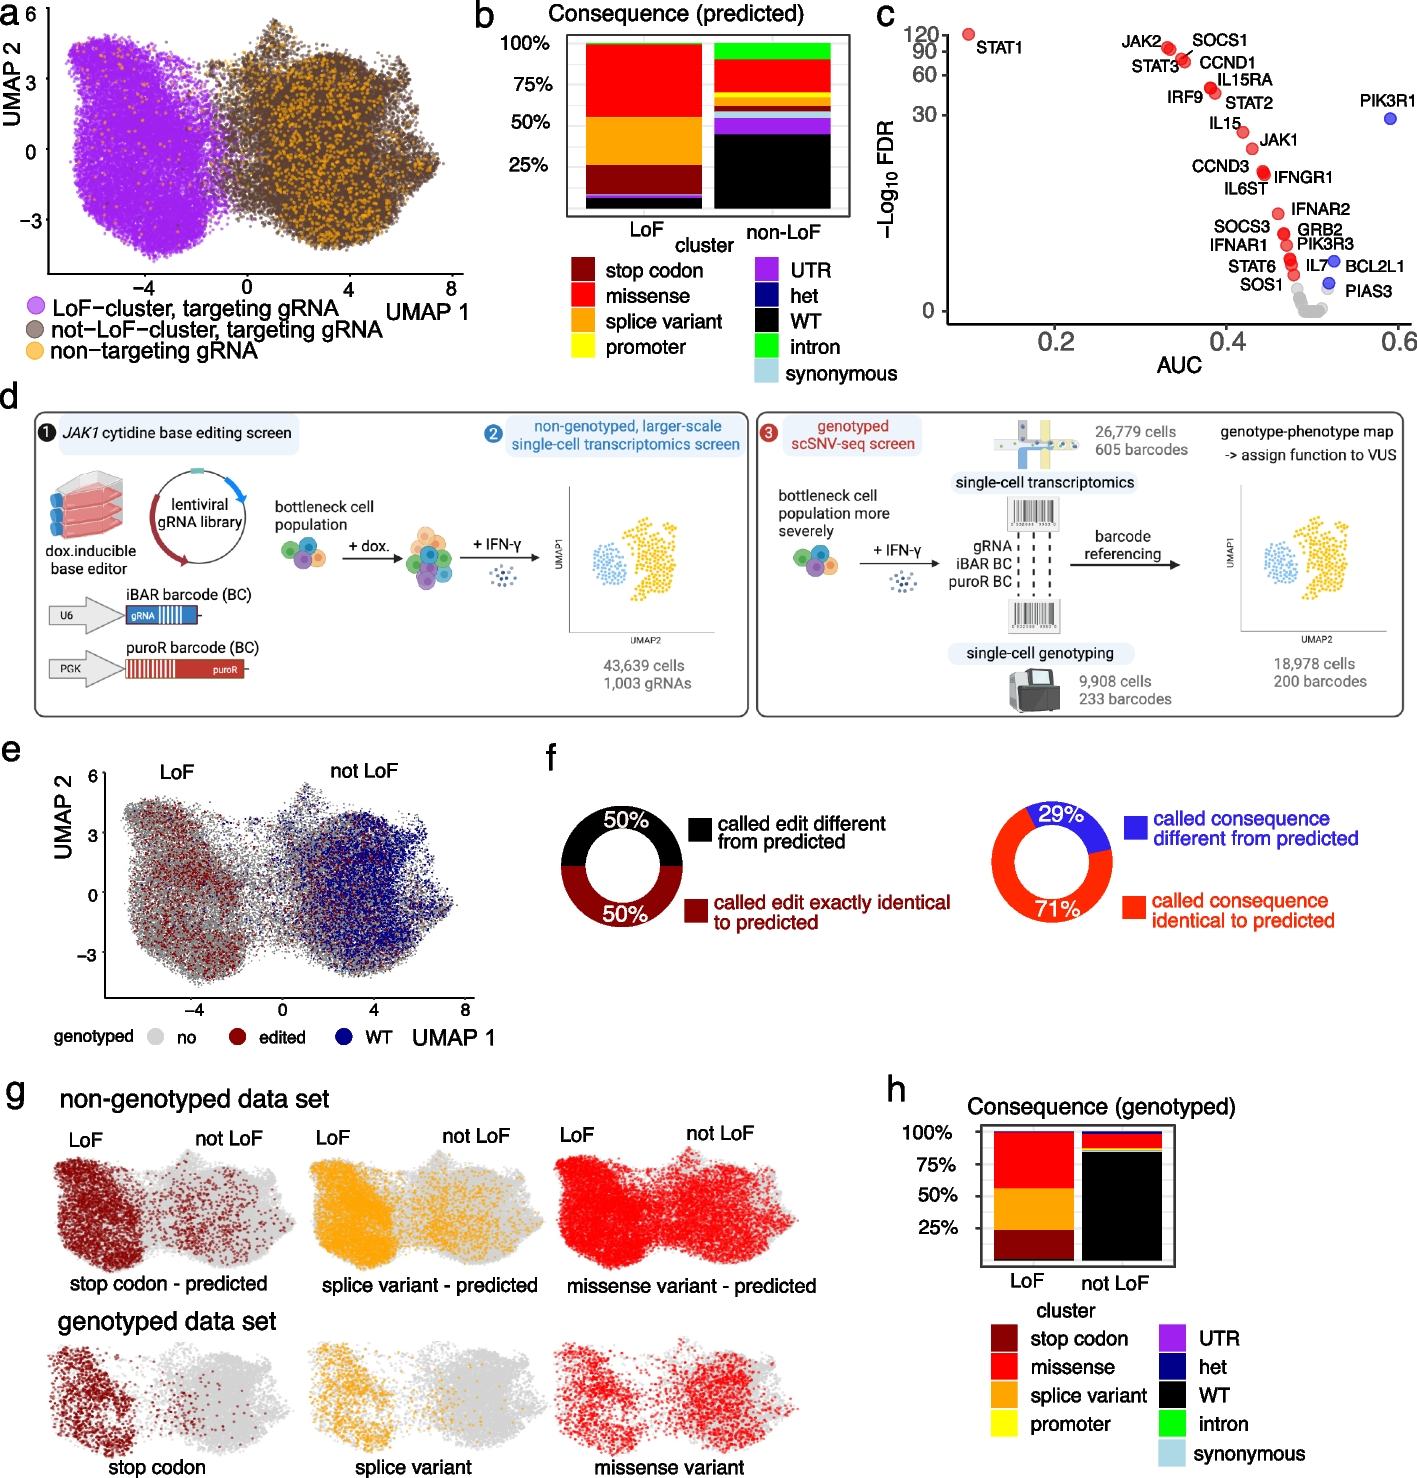
a UMAP of LoF and not LoF meta-clusters for the non-genotyped experiment including all cells with a uniquely assigned gRNA. NT-gRNAs are highlighted in orange. b Distribution of consequences of the predicted mutations for each cluster. c Differential gene expression analysis of JAK-STAT pathway genes between the LoF cluster and non-targeting gRNAs. AUC < 0.5 indicates downregulation (red, if significant) and AUC > 0.5 upregulation (blue, if significant). d Overview of high-throughput SNV phenotyping. Base editing of JAK1 was achieved through the introduction of a barcoded gRNA library into a doxycycline-inducible cytidine base editor expressing HT-29 cancer cells (left panel, 1). After editing, cells were induced with IFN-γ before single-cell transcriptomics (left panel, 2) or bottlenecked and processed for targeted single-cell DNA sequencing (right panel, 3). Transcriptomes and edited genotypes of single cells were linked through genetic barcodes to assign function to variants of unknown significance (VUS). e UMAP combining the non-genotyped (gray) data set with all genotyped cells with confidently called genotype (GT, 18,978 cells). Red and blue indicate edited and wild-type (WT) cells respectively. f Percentage of barcodes for which the called homozygous DNA editing is exactly the same as predicted based on complete editing in the window (maroon/black) or for which the functional consequences of the edit on the protein sequence are the same (red/blue). g UMAPs highlighting mutational consequences for the predicted genotypes (upper, non-genotyped data set) compared to the called genotypes (lower, genotyped data set). The colored cells are homozygous stop codon (brown), splice (yellow), or missense variants (red), with other cells shown in gray. Compare to Additional file 1: Fig. S2i. h Percentages of cells showing the consequence of mutations from actual genotyping in LoF and not LoF clusters. For the assignment of probable consequences using VEP, only homozygous mutations were included, as heterozygous edits are not expected to have a strong functional consequence.
Availability – Code is available on GitHub: https://github.com/MarioniLab/scSNV-seq
Cooper SE, Coelho MA, Strauss ME, Gontarczyk AM, Wu Q, Garnett MJ, Marioni JC, Bassett AR. (2024) scSNV-seq: high-throughput phenotyping of single nucleotide variants by coupled single-cell genotyping and transcriptomics. Genome Biol 25(1):20. [article]


