

Understanding the tumor microenvironment (TME) and anti-tumor immune responses in gastric cancer are required for precision immune-oncology. Taking advantage of next-generation sequencing technology, researchers from the University of Tokyo investigated the feasibility and reliability of transcriptome-based TME analysis. TME of 30 surgically resected gastric cancer tissues was analyzed by RNA-Seq, immunohistochemistry (IHC) and flow cytometry (FCM). RNA-Seq of bulk gastric cancer tissues was computationally analyzed to evaluate TME. Computationally analyzed immune cell composition was validated by comparison with cell densities established by IHC and FCM from the same tumor tissue. Immune cell infiltration and cellular function were also validated with IHC and FCM. Cell proliferation and cell death in the tumor as assessed by RNA-Seq and IHC were compared. Computational tools and gene set analysis for quantifying CD8+ T cells, regulatory T cells and B cells, T cell infiltration and functional status, and cell proliferation and cell death status yielded an excellent correlation with IHC and FCM data. Using these validated transcriptome-based analyses, the immunological status of gastric cancer could be classified into immune-rich and immune-poor subtypes. Transcriptome-based TME analysis is feasible and is valuable for further understanding the immunological status of gastric cancer.
Transcriptome-based TME analysis with selected reliable gene sets in gastric cancer
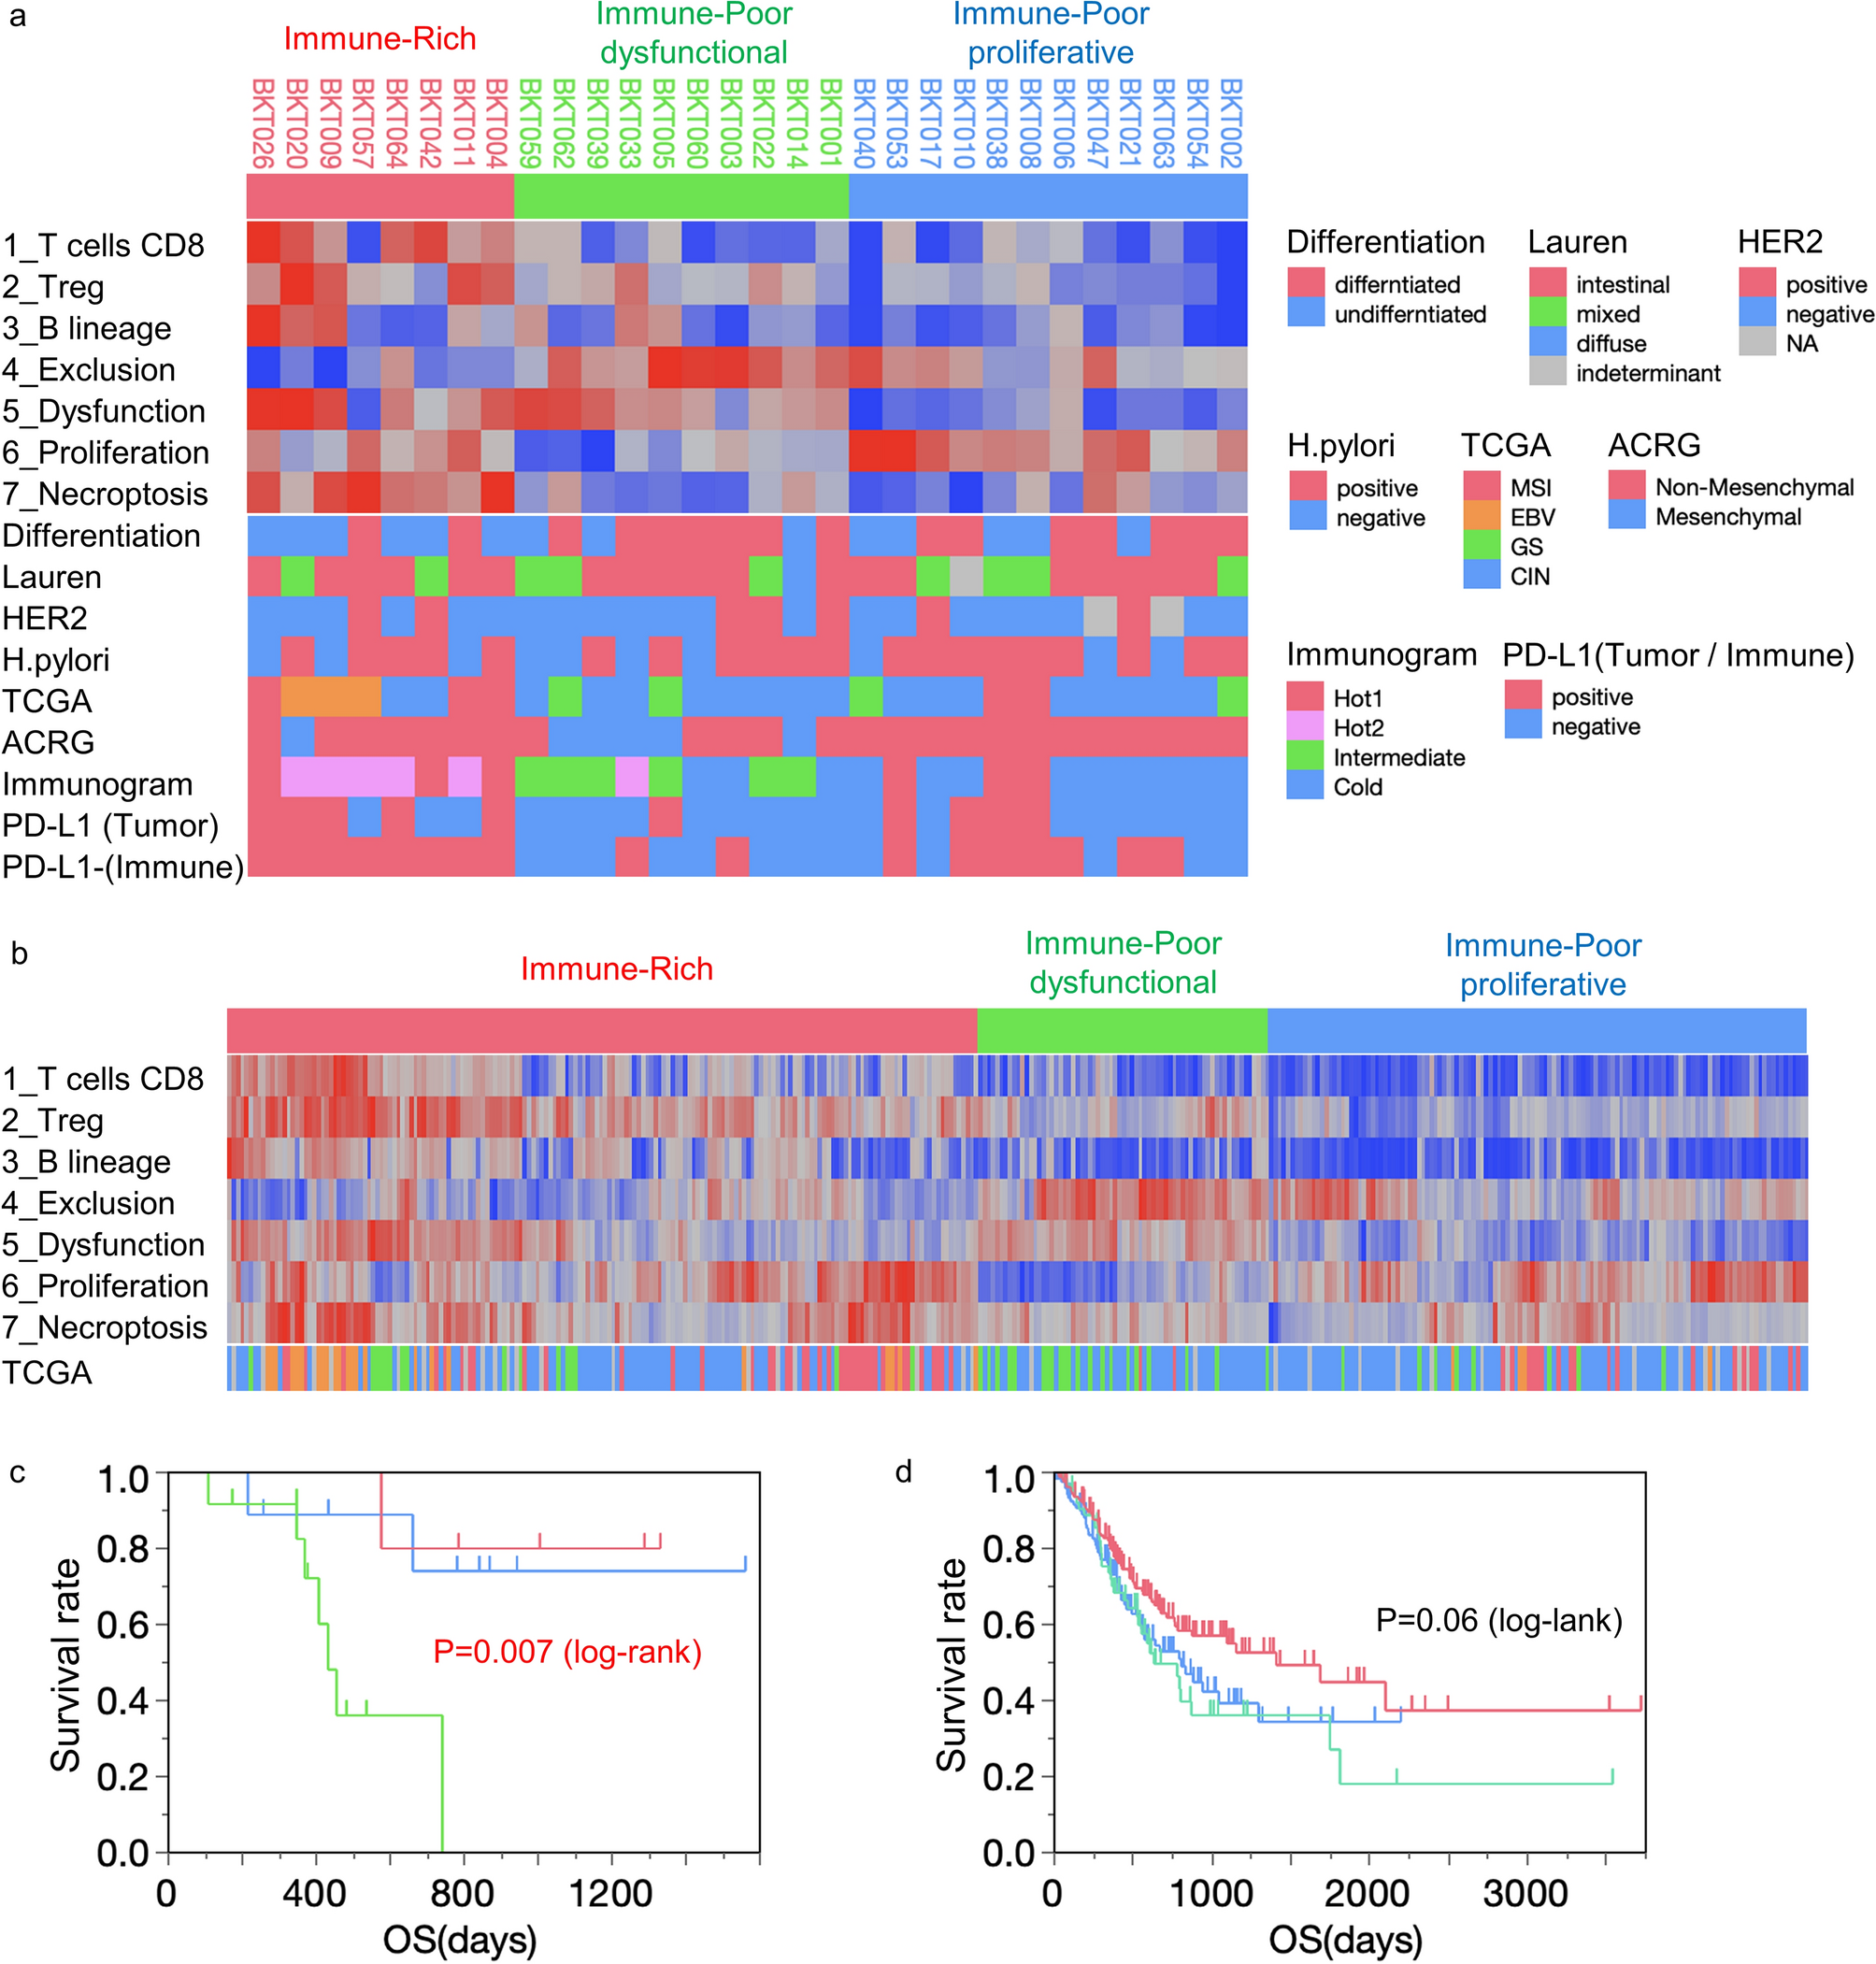
(a) Hierarchical cluster analysis was performed in our 30 gastric cancer patients (BKT Cohort). Degree of tumor differentiation, Lauren classification, HER2 status, Helicobacter pylori infection, TCGA subtype, the Asian Cancer Research Group (ACRG) Mesenchymal subtype, Sato’s immunogram classification (IGS) and PD-L1 IHC are displayed at the bottom. (b) Gastric cancer patients from the TCGA cohort (n = 375) were subjected to hierarchical clustering with 7 transcriptome-based TME analyses. The molecular classification of TCGA is indicated at the bottom. Survival analysis for Immune-Rich (IR, red), Immune-Poor dysfunctional (IPd, green) and Immune-Poor proliferative (IPp, blue) groups. The Kaplan–Meier method and log-rank test were performed in BKT cohort (c) and TCGA cohort (d).
Saito N, Sato Y, Abe H, Wada I, Kobayashi Y, Nagaoka K, Kushihara Y, Ushiku T, Seto Y, Kakimi K. (2022) Selection of RNA-based evaluation methods for tumor microenvironment by comparing with histochemical and flow cytometric analyses in gastric cancer. Sci Rep 12(1):8576. [article]


