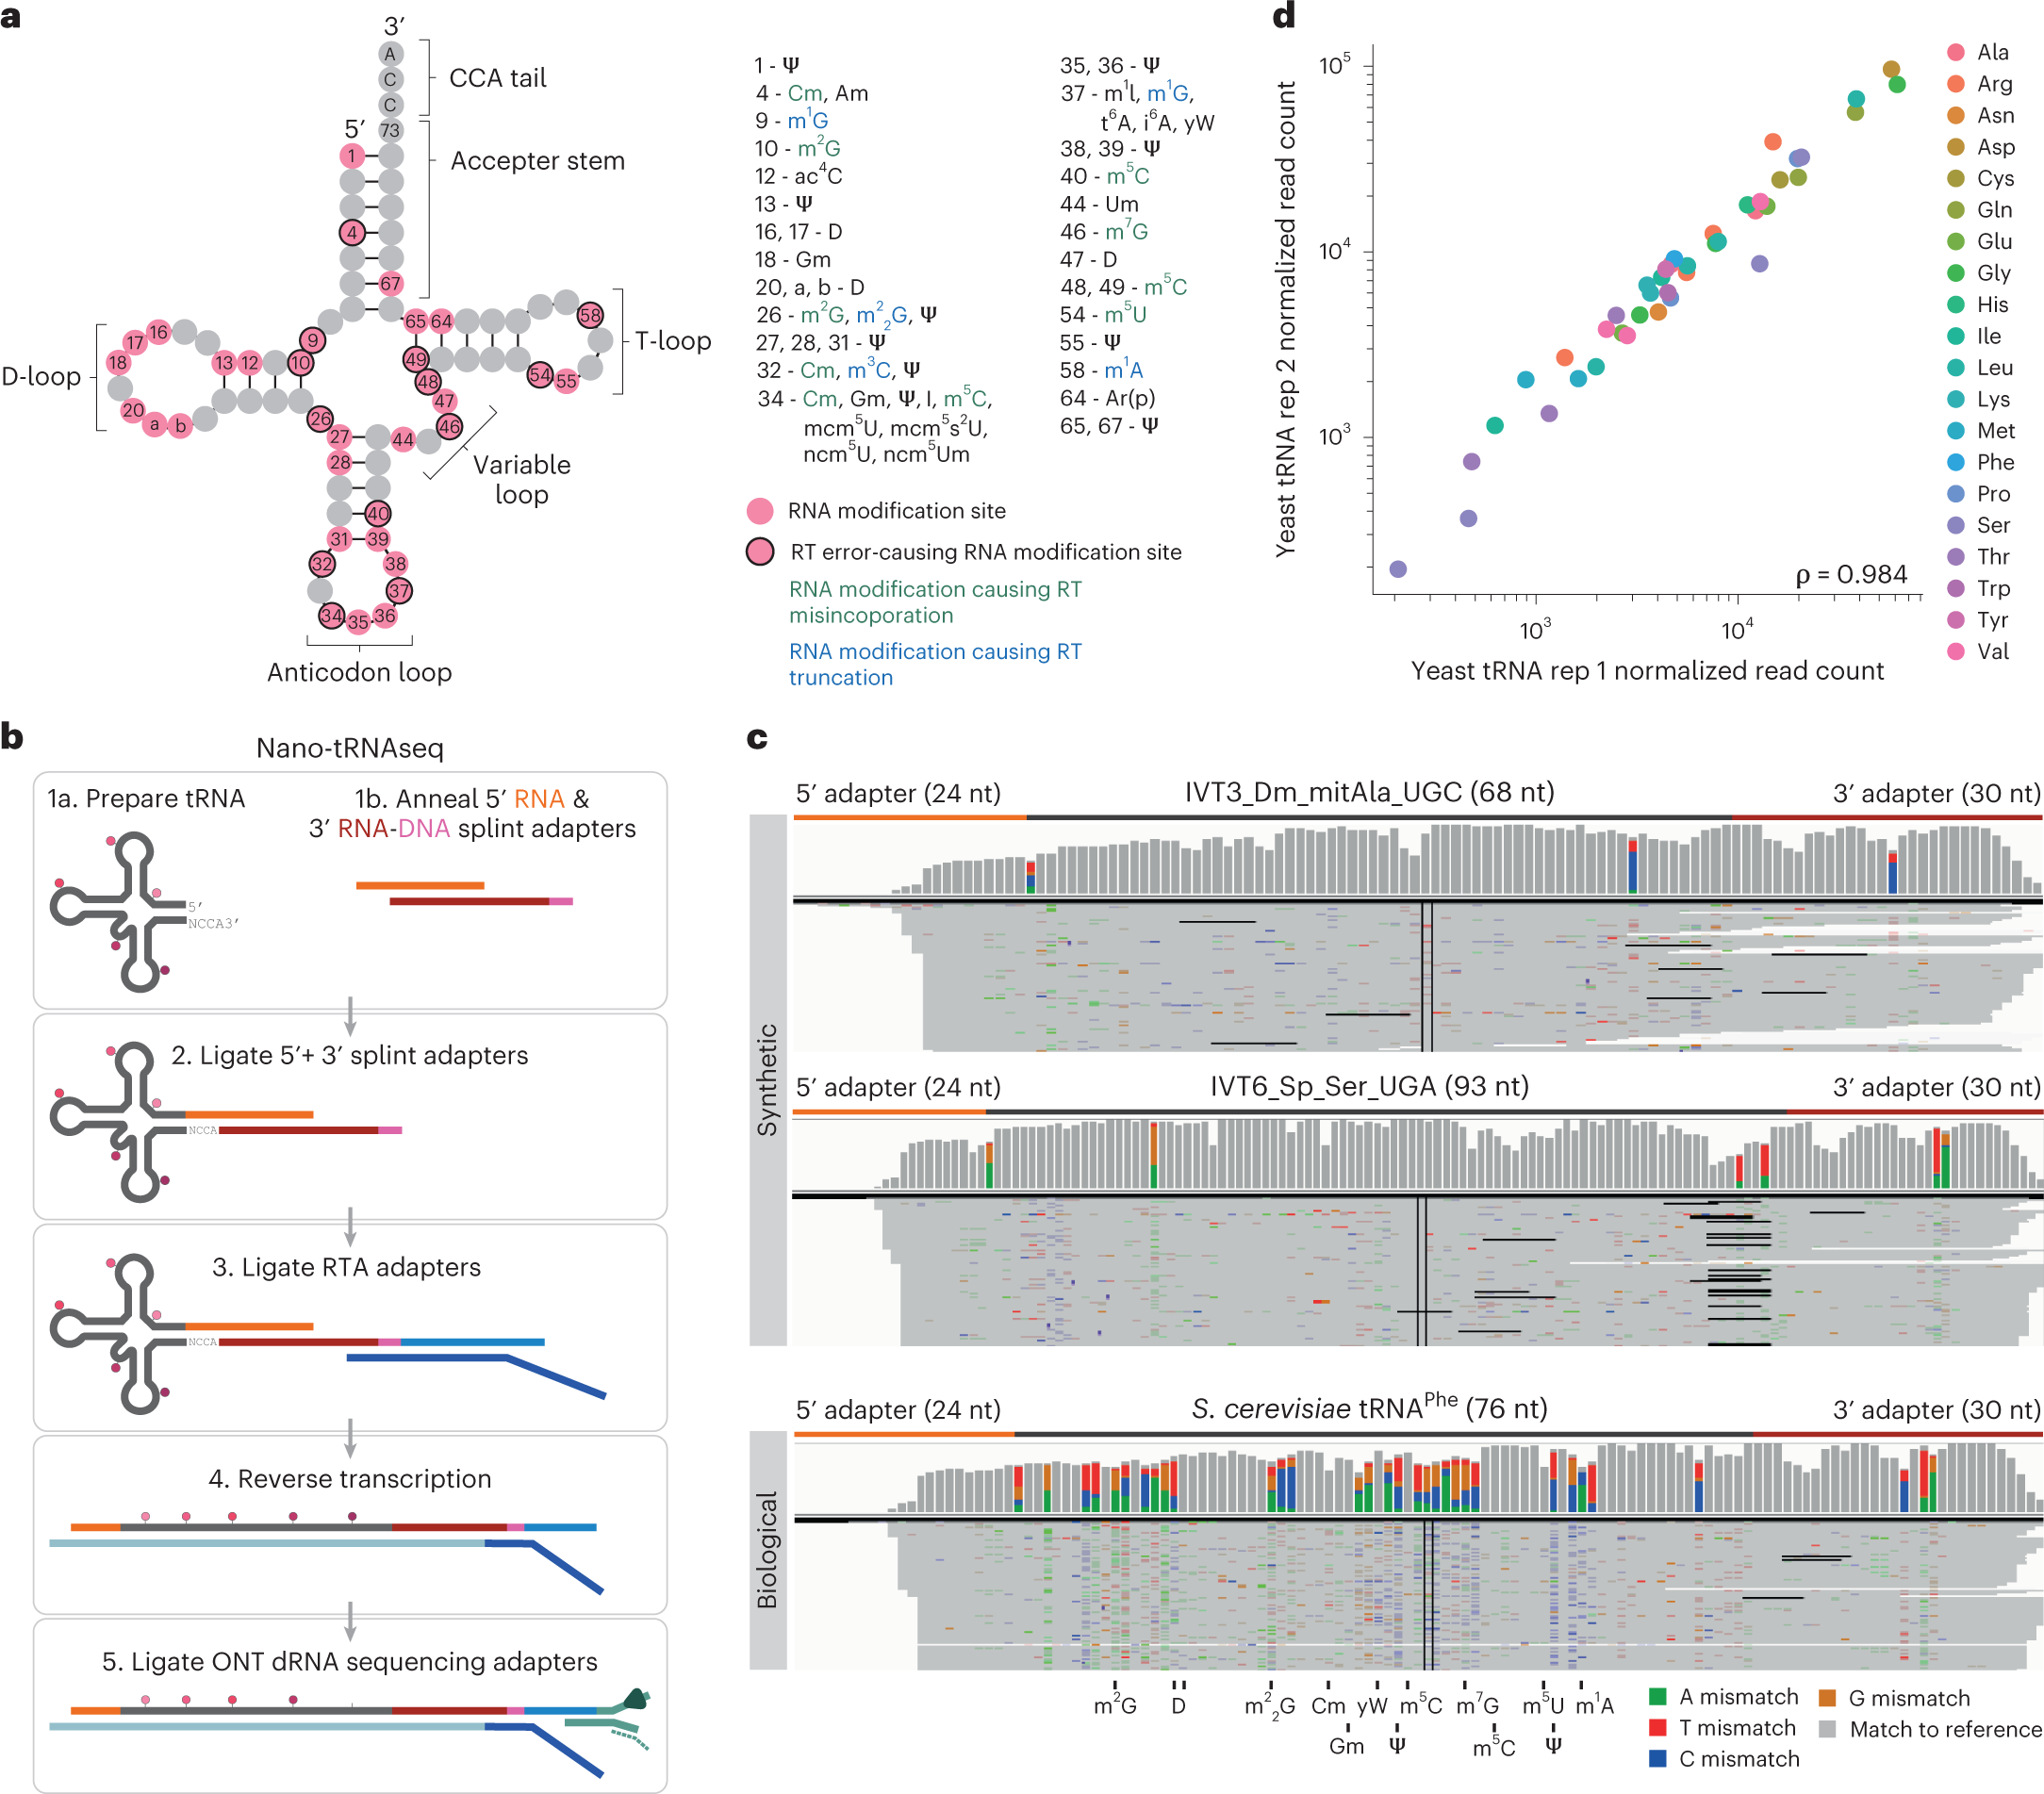
Transfer RNAs (tRNAs) play a central role in protein translation. Studying them has been difficult in part because a simple method to simultaneously quantify their abundance and chemical modifications is lacking. Researchers at the Centre for Genomic Regulation (CRG), Spain have developed Nano-tRNAseq, a nanopore-based approach to sequence native tRNA populations that provides quantitative estimates of both tRNA abundances and modification dynamics in a single experiment. The researchers show that default nanopore sequencing settings discard the vast majority of tRNA reads, leading to poor sequencing yields and biased representations of tRNA abundances based on their transcript length. Re-processing of raw nanopore current intensity signals leads to a 12-fold increase in the number of recovered tRNA reads and enables recapitulation of accurate tRNA abundances. The researchers then apply Nano-tRNAseq to Saccharomyces cerevisiae tRNA populations, revealing crosstalks and interdependencies between different tRNA modification types within the same molecule and changes in tRNA populations in response to oxidative stress.
Nano-tRNAseq can efficiently sequence both IVT and native tRNA populations
a, Schematic of the modifications found in S. cerevisiae cytoplasmic tRNA, shown in its usual secondary structure form with circles representing nucleotides and lines representing base pairs. Gray circles represent unmodified nucleotides; pink circles represent possible modification sites; and those with a black outline indicate modifications that cause errors during reverse transcription. Possible RNA modifications occurring at each position are listed in the surrounding boxes; modifications that cause misincorporation during reverse transcription are in green; and those that cause reverse transcription truncation are in blue. b, Schematic overview illustrating the steps required for tRNA library preparation using Nano-tRNAseq (see Extended Data Fig. 1 for more details). c, IGV snapshots of Nano-tRNAseq mapped reads from synthetic IVT tRNAs (upper panels) or biological tRNAs (lower panel). Positions with a mismatch frequency greater than 0.2 are colored, whereas those showing mismatch frequencies lower than 0.2 are shown in gray. d, Scatter plot of tRNA abundances showing the replicability of Nano-tRNAseq when WT S. cerevisiae tRNA biological replicates are sequenced. The correlation strength is indicated by Spearman’s correlation coefficient (ρ). RT, reverse transcription.
Availability – The reference FASTA, alignment and modification BED files, custom MinKNOW configurations and all code used to analyze the runs are publicly available on GitHub (https://github.com/novoalab/Nano-tRNAseq)
Lucas MC, Pryszcz LP, Medina R, Milenkovic I, Camacho N, Marchand V, Motorin Y, Ribas de Pouplana L, Novoa EM. (2023) Quantitative analysis of tRNA abundance and modifications by nanopore RNA sequencing. Nat Biotechnol [Epub ahead of print]. [article]


