

Single-cell RNA-sequencing (scRNA-seq) technologies enable the capture of gene expression heterogeneity and consequently facilitate the study of cell-to-cell variability at the cell type level. Although different methods have been proposed to quantify cell-to-cell variability, it is unclear what the optimal statistical approach is, especially in light of challenging data structures that are unique to scRNA-seq data like zero inflation.
Researchers at the University of Queensland systematically evaluated the performance of 14 different variability metrics that are commonly applied to transcriptomic data for measuring cell-to-cell variability. Leveraging simulations and real datasets, the researchers benchmarked the metric performance based on data-specific features, sparsity and sequencing platform, biological properties, and the ability to recapitulate true levels of biological variability based on known gene sets. Next, they used scran, the metric with the strongest all-round performance, to investigate changes in cell-to-cell variability that occur during B cell differentiation and the aging processes. The analysis of primary cell types from hematopoietic stem cells (HSCs) and B lymphopoiesis reveals unique gene signatures with consistent patterns of variable and stable expression profiles during B cell differentiation which highlights the significance of these methods. Identifying differentially variable genes between young and old cells elucidates the regulatory changes that may be overlooked by solely focusing on mean expression changes and we investigate this in the context of regulatory networks.
Schematic summaries of the benchmark workflow to evaluate
the performance of cell-to-cell variability metrics for scRNA-seq data
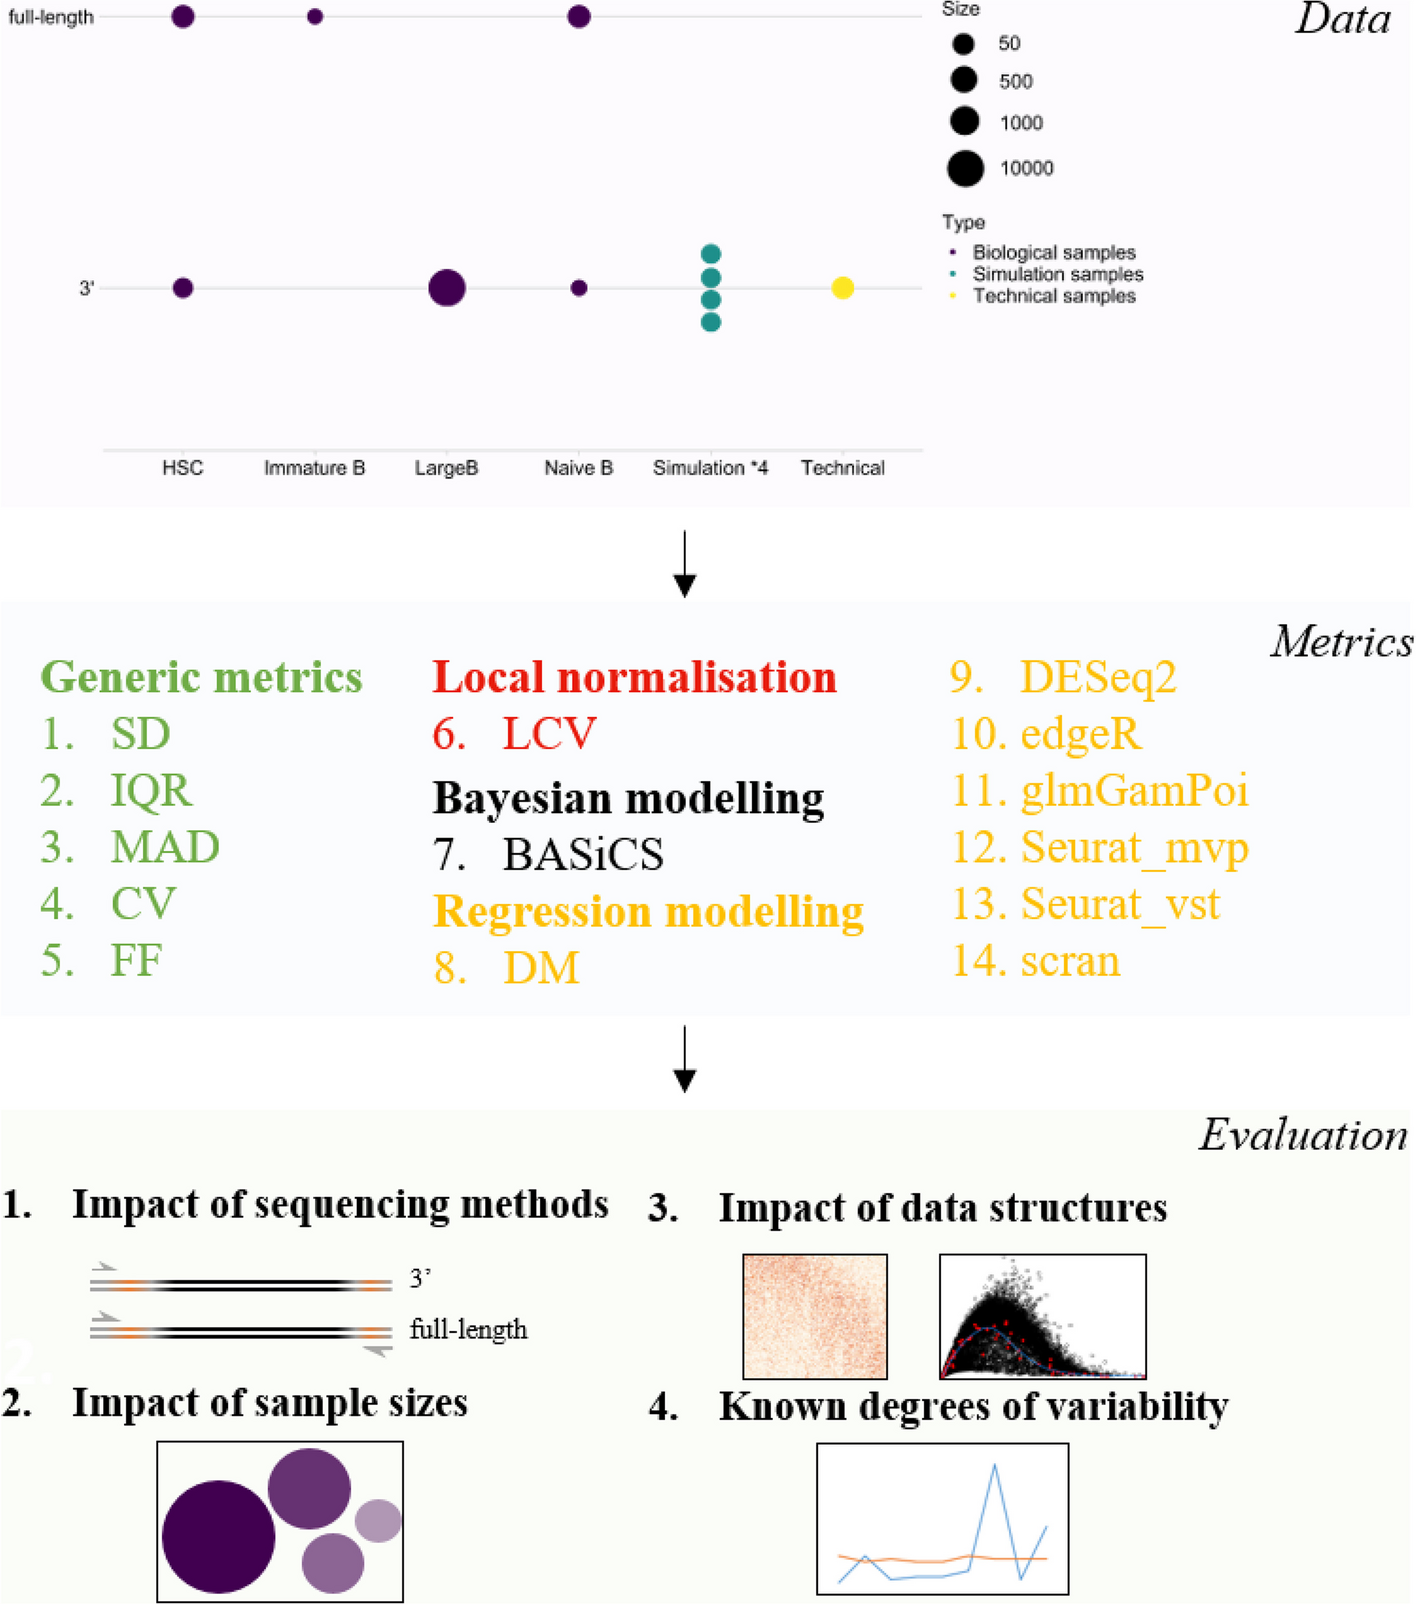
A panel of 14 metrics that perform the estimation of cell-to-cell variability were evaluated on both experimentally-derived and simulated data from two main sequencing platforms with different sample sizes. Evaluation includes the impact of sequencing platforms, sample sizes, data structures, and the recapitulation of known degrees of variability. Other than generic metrics, other metrics are designed for analyzing transcriptomic data and implemented following package tutorials. All metrics can be processed through the wrapper method scVar.
These researchers highlight the importance of capturing cell-to-cell gene expression variability in a complex biological process like differentiation and aging and emphasize the value of these findings at the level of individual cell types.
Zheng H, Vijg J, Fard AT, Mar JC. (2023) Measuring cell-to-cell expression variability in single-cell RNA-sequencing data: a comparative analysis and applications to B cell aging. Genome Biol 24(1):238. [article]


