

Intra-tumour heterogeneity (ITH) presents a significant obstacle in formulating effective treatment strategies in clinical practice. Single-cell RNA sequencing (scRNA-seq) has evolved as a powerful instrument for probing ITH at the transcriptional level, offering an unparalleled opportunity for therapeutic intervention.
Drug response prediction at the single-cell level is an emerging field of research that aims to improve the efficacy and precision of cancer treatments. Researchers at the Telethon Institute of Genetics and Medicine have developed DREEP (Drug Response Estimation from single-cell Expression Profiles), a computational method that leverages publicly available pharmacogenomic screens from GDSC2, CTRP2, and PRISM and functional enrichment analysis to predict single-cell drug sensitivity from transcriptomic data. The researchers validated DREEP extensively in vitro using several independent single-cell datasets with over 200 cancer cell lines and showed its accuracy and robustness. Additionally, they also applied DREEP to molecularly barcoded breast cancer cells and identified drugs that can selectively target specific cell populations.
Drug Response Estimation from single-cell Expression Profiles (DREEP)
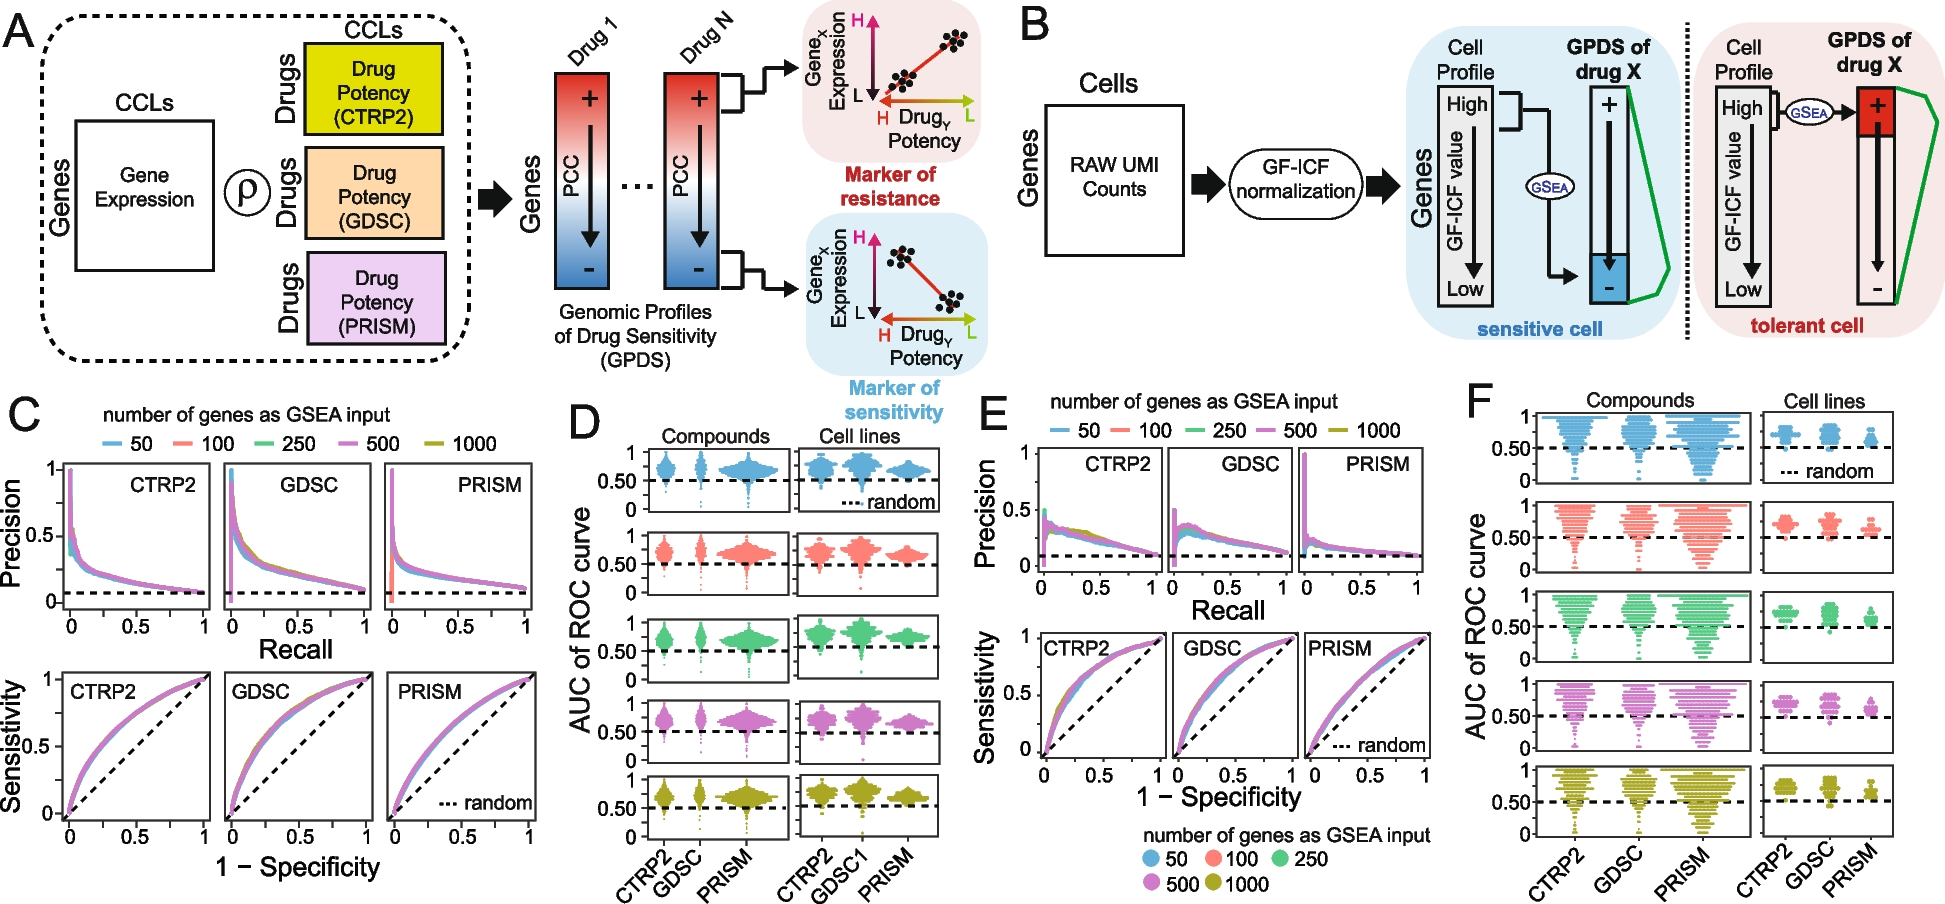
A Construction of Genomic Profiles of Drug Sensitivity (GPDS). The potency profile of each drug in terms of AUC (area under the curve) is correlated with the expression of all messenger RNA across the cell lines for which the drug potency was measured. B Bioinformatics pipeline for the prediction of single-cell drug response. Raw UMI counts are first normalized with the gf-icf pipeline, and then, the most relevant genes in a single cell are used as input for a GSEA against the GPDS ranked list to predict its drug sensitivity. C Performance of DREEP drug sensitivity on 198 cell lines for each set of GPDS signatures used and different numbers of relevant genes to predict the effect of a drug. DREEP’s performance is estimated using either precision-recall curve (upper) or ROC curve (bottom). Max AUC of ROC curves are CTRP2 = 0.691, GDSC = 0.728, and PRISM = 0.661. D Left column: Each point is a drug whose y-coordinate is AUC of the corresponding ROC curve across the 198 cell lines and computed by sorting cell lines from the most to the least sensitive to the drug. Each panel reports the results using different numbers of relevant genes to predict the effect of the drug. Right column: Each point is a cell line whose y-coordinate is the AUC of the corresponding ROC curve obtained by sorting drug predictions from the most to the least sensitive. Each panel reports the results using different numbers of relevant genes to predict the effect of a drug. E Same as C but for the 32 breast cancer cell lines published in Gambardella et al. Max AUC of ROC curves are CTRP2 = 0.721, GDSC = 0.699, and PRISM = 0.637. F Same as D but for 32 breast cancer cell lines published in Gambardella et al.
DREEP provides an in silico framework to prioritize drugs from single-cell transcriptional profiles of tumours and thus helps in designing personalized treatment strategies and accelerating drug repurposing studies.
Availability – DREEP is available at https://github.com/gambalab/DREEP.
Pellecchia S, Viscido G, Franchini M, Gambardella G. (2023) Predicting drug response from single-cell expression profiles of tumours. BMC Med 21(1):476. [article]


