

With the growing number of single-cell datasets collected under more complex experimental conditions, there is an opportunity to leverage single-cell variability to reveal deeper insights into how cells respond to perturbations. Many existing approaches rely on discretizing the data into clusters for differential gene expression (DGE), effectively ironing out any information unveiled by the single-cell variability across cell-types. In addition, DGE often assumes a statistical distribution that, if erroneous, can lead to false positive differentially expressed genes.
Researchers at the University of North Carolina at Chapel Hill have developed Cellograph: a semi-supervised framework that uses graph neural networks to quantify the effects of perturbations at single-cell granularity. Cellograph not only measures how prototypical cells are of each condition but also learns a latent space that is amenable to interpretable data visualization and clustering. The learned gene weight matrix from training reveals pertinent genes driving the differences between conditions. The researchers demonstrate the utility of their approach on publicly-available datasets including cancer drug therapy, stem cell reprogramming, and organoid differentiation. Cellograph outperforms existing methods for quantifying the effects of experimental perturbations and offers a novel framework to analyze single-cell data using deep learning.
Illustrative overview of Cellograph algorithm
Single-cell data collected from multiple sample drug treatments
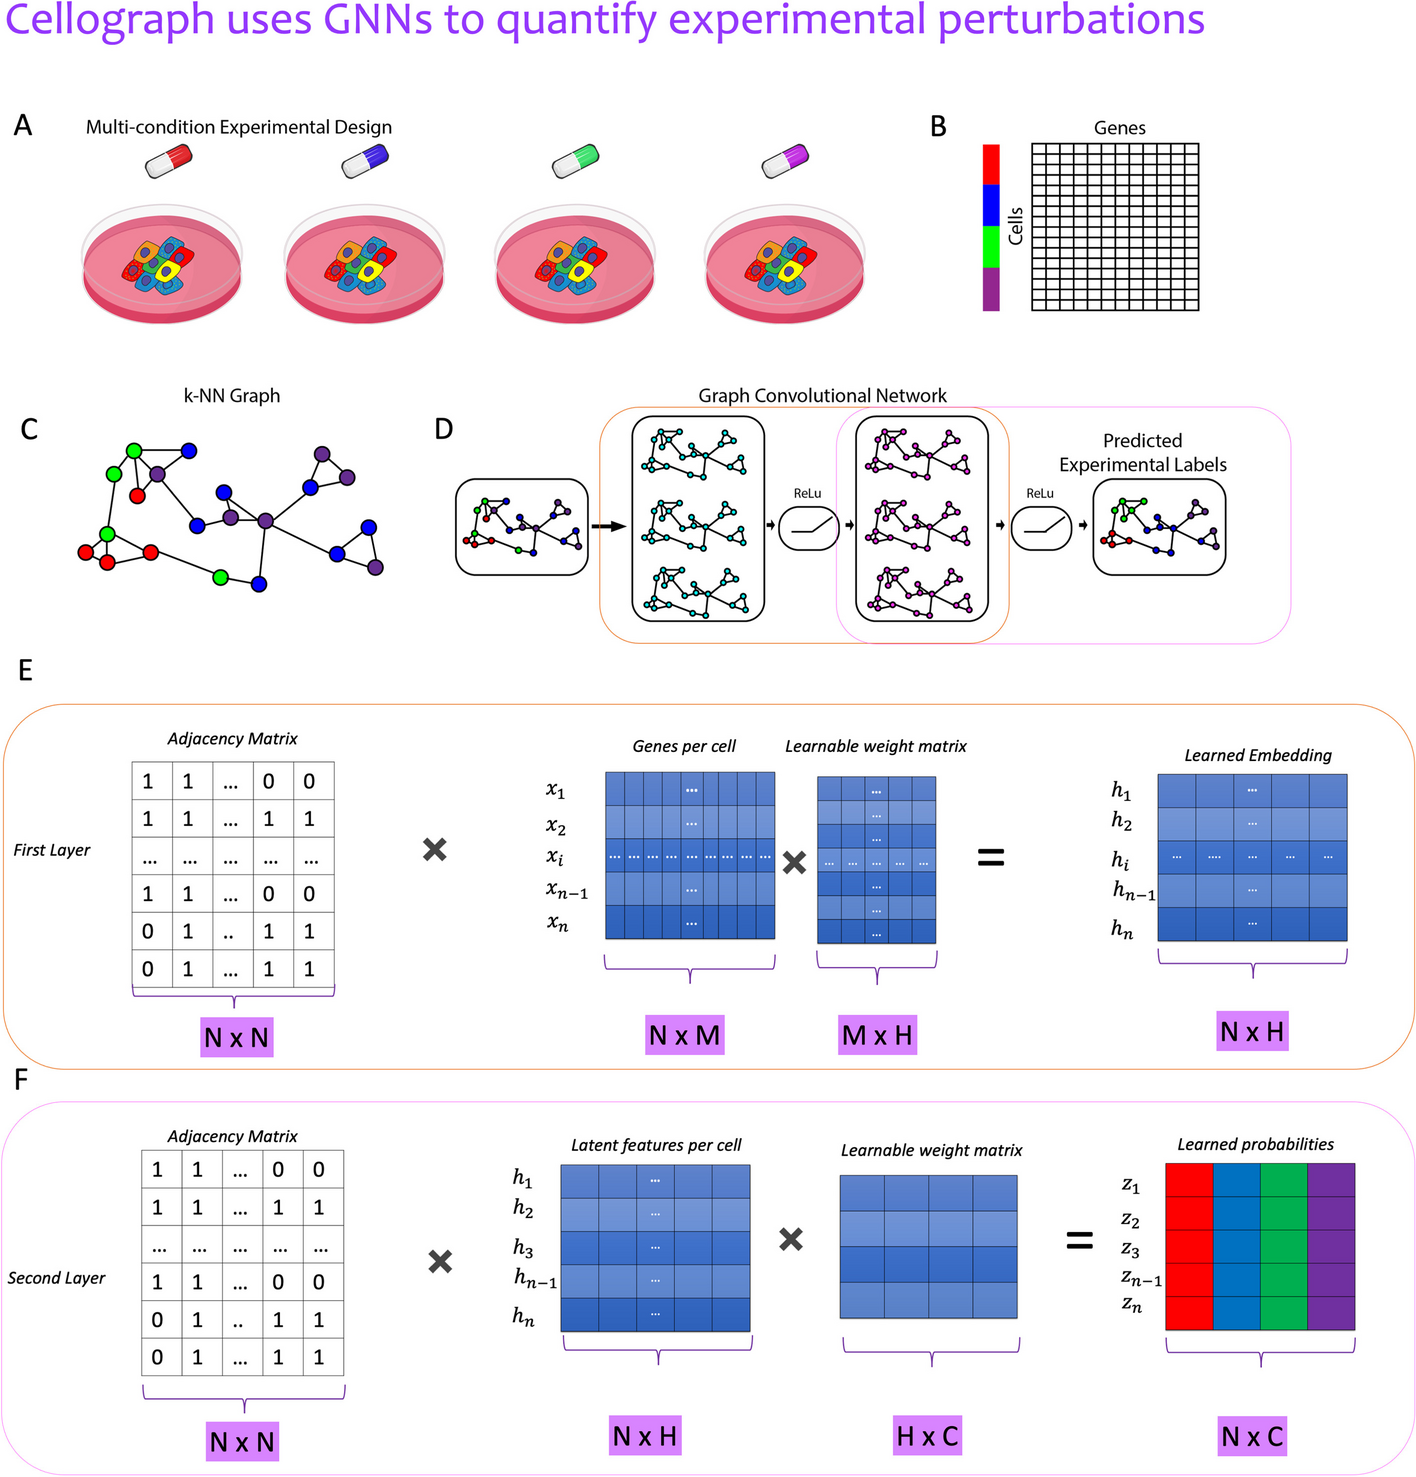
(A, B) is converted to a kNN graph (C), where cells are nodes, and edges denote connections between transcriptionally similar cells. The colored rectangles (B) correspond to the different samples represented by the drugs in A. This kNN is fed in as input to a two-layer GCN (D) that quantitatively and visually learns how prototypical each cell is of its experimental label through the learned latent embedding. E A mathematical schematic of the first layer, where each cell’s gene expression and its neighbors’s gene expression is aggregated to produce a lower-dimensional representation of the cell in a latent space. F A mathematical schematic of the second layer respectively, where the output embedding of the first layer is mapped to softmax probabilities of cells belonging to each of the drug treatments
Availability – The code and installation insturctions for Cellograph can be found at https://github.com/jashahir/cellograph.
Shahir JA, Stanley N, Purvis JE. (2024) Cellograph: a semi-supervised approach to analyzing multi-condition single-cell RNA-sequencing data using graph neural networks. BMC Bioinformatics 25(1):25. [article]


