Neuronal pathways recruit large postsynaptic populations and maintain connections via distinct postsynaptic response types (PRTs). Until recently, PRTs were only accessible as a selection criterion for single-cell RNA-sequencing (scRNA-seq) through probing by low-throughput whole-cell electrophysiology. To overcome these limitations and target neurons based on specific PRTs for soma collection and subsequent scRNA-seq, Karolinska Institutet researchers have developed Voltage-Seq. An on-site analysis tool, VoltView, was created to guide soma harvesting of specific PRTs using a classifier based on a previously acquired connectome database from multiple animals.
The researchers present a detailed step-by-step protocol, including setting up the optical path, the imaging setup, detailing the imaging procedure, and analysis, the reagents and protocols, complete procedure for sequencing library preparation, and provide other tips and pitfalls to assist researchers in conducting high-throughput all-optical voltage imaging, and to obtain the single-cell transcriptomic data from selected postsynaptic neurons.
Voltage-seq workflow can be completed in ∼6 weeks including 4-5 weeks of viral expression of the Voltron sensor. The approach allows researchers to resolve the connectivity ratio of a specific pathway and explore the diversity of PRTs within that connectome. Furthermore, the high throughput in conjunction with quick analysis gives unique access to find specific connections within a large postsynaptic connectome. Voltage-seq also allows the investigation of correlations between connectivity and gene expression changes in a postsynaptic cell-type-specific manner in both excitatory and inhibitory connections.
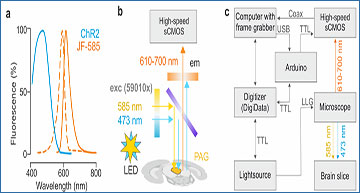
All-optical imaging setup and optics
a, Excitation, and emission profile of ChR2 (blue) and JF-585 (orange). b, Optical paths of all-optical voltage imaging ex vivo with double band excitation filter 59010x (blue to yellow), dichroic mirror T612lprx (purple), pass emission filter ET645/75 (orange) c, Block diagram of the connected instruments of the all-optical imaging setup. d, All-optical voltage imaging protocol of one typical sweep. (Top) TTL signal from DigiData activating the 473 nm channel of the light source to deliver 20 Hz opto-stimulation, (Middle) TTL signal from DigiData activating the 585 nm channel of the light source to continuously excite Voltron-JF585. (Bottom) TTL signal from Arduino at 600 Hz to trigger the acquisition of each frame.
Availability – VoltView is available for download from: https://zenodo.org/records/8030176
Csillag V, Noble C, Calvigioni D, Reinius B, Fuzik J. (2023) All-optical voltage imaging-guided postsynaptic single-cell transcriptome profiling with Voltage-Seq. bioRXiv [online preprint]. [abstract]


