Enhancers and transcription factors (TFs) are crucial in regulating cellular processes, including disease-associated cell states. Current multiomic technologies to study these elements in gene regulatory mechanisms lack multiplexing capability and scalability. Researchers at the EMBL have developed SUM-seq, a cost-effective, scalable Single-cell Ultra-high-throughput Multiomic sequencing method for co-assaying chromatin accessibility and gene expression in single nuclei. SUM-seq enables profiling hundreds of samples at the million cell scale and outperforms current high-throughput single-cell methods. The researchers applied SUM-seq to dissect the gene regulatory mechanisms governing macrophage polarization and explored their link to traits from genome-wide association studies (GWAS). Their analyses confirmed known TFs orchestrating M1 and M2 macrophage programs, unveiled key regulators, and demonstrated extensive enhancer rewiring. Integration with GWAS data further pinpointed the impact of specific TFs on a set of immune traits. Notably, inferred enhancers regulated by the STAT1/STAT2/IRF9 (ISGF3) complex were enriched for rheumatoid arthritis-associated genetic variants, and their target genes included known drug targets. This highlights the potential of SUM-seq for dissecting molecular disease mechanisms. SUM-seq offers a cost-effective, scalable solution for ultra-high-throughput single-cell multiomic sequencing, excelling in unraveling complex gene regulatory networks in cell differentiation, responses to perturbations, and disease studies.
SUM-seq allows simultaneous profiling of chromatin accessibility
and gene expression in single cells at ultra-high-throughput scale
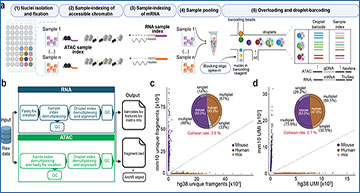
a, Schematic depiction of the SUM-seq workflow. Key steps and detailed structures are described in the main text and Extended Data Figure 1. b, Schematic overview of the computational analysis pipeline. c, d, Species-mixing plots for the ATAC (c) and the RNA (d) modality, indicating the fraction of reads from singlets and multiplets assigned to the mouse genome (mm10, y-axes) and the human genome (hg38, x-axes). Genomic DNA fragments (c) and transcripts (d) are demultiplexed based on the combination of the sample index and the microfluidic index. The pie chart shows the fraction of human and mouse cells as well as the frequency of multiplets and singlets.
Lobato-Moreno S, Yildiz U, Claringbould A, Servaas NH, Vlachou EP, Arnold C, Bauersachs HG, Campos-Fornes V, Prummel KD, Noh KM, Marttinen M, Zaugg B. (2023) Scalable ultra-high-throughput single-cell chromatin and RNA sequencing reveals gene regulatory dynamics linking macrophage polarization to autoimmune disease. bioRXiv [online preprint]. [abstract]


