

Spatial transcriptomics and proteomics provide complementary information that independently transformed our understanding of complex biological processes. However, experimental integration of these modalities is limited. To overcome this, Weill Cornell Medicine researchers developed Spatial PrOtein and Transcriptome Sequencing (SPOTS) for high-throughput simultaneous spatial transcriptomics and protein profiling. Compared with unimodal measurements, SPOTS substantially improves signal resolution and cell clustering and enhances the discovery power in differential gene expression analysis across tissue regions.
SPOTS
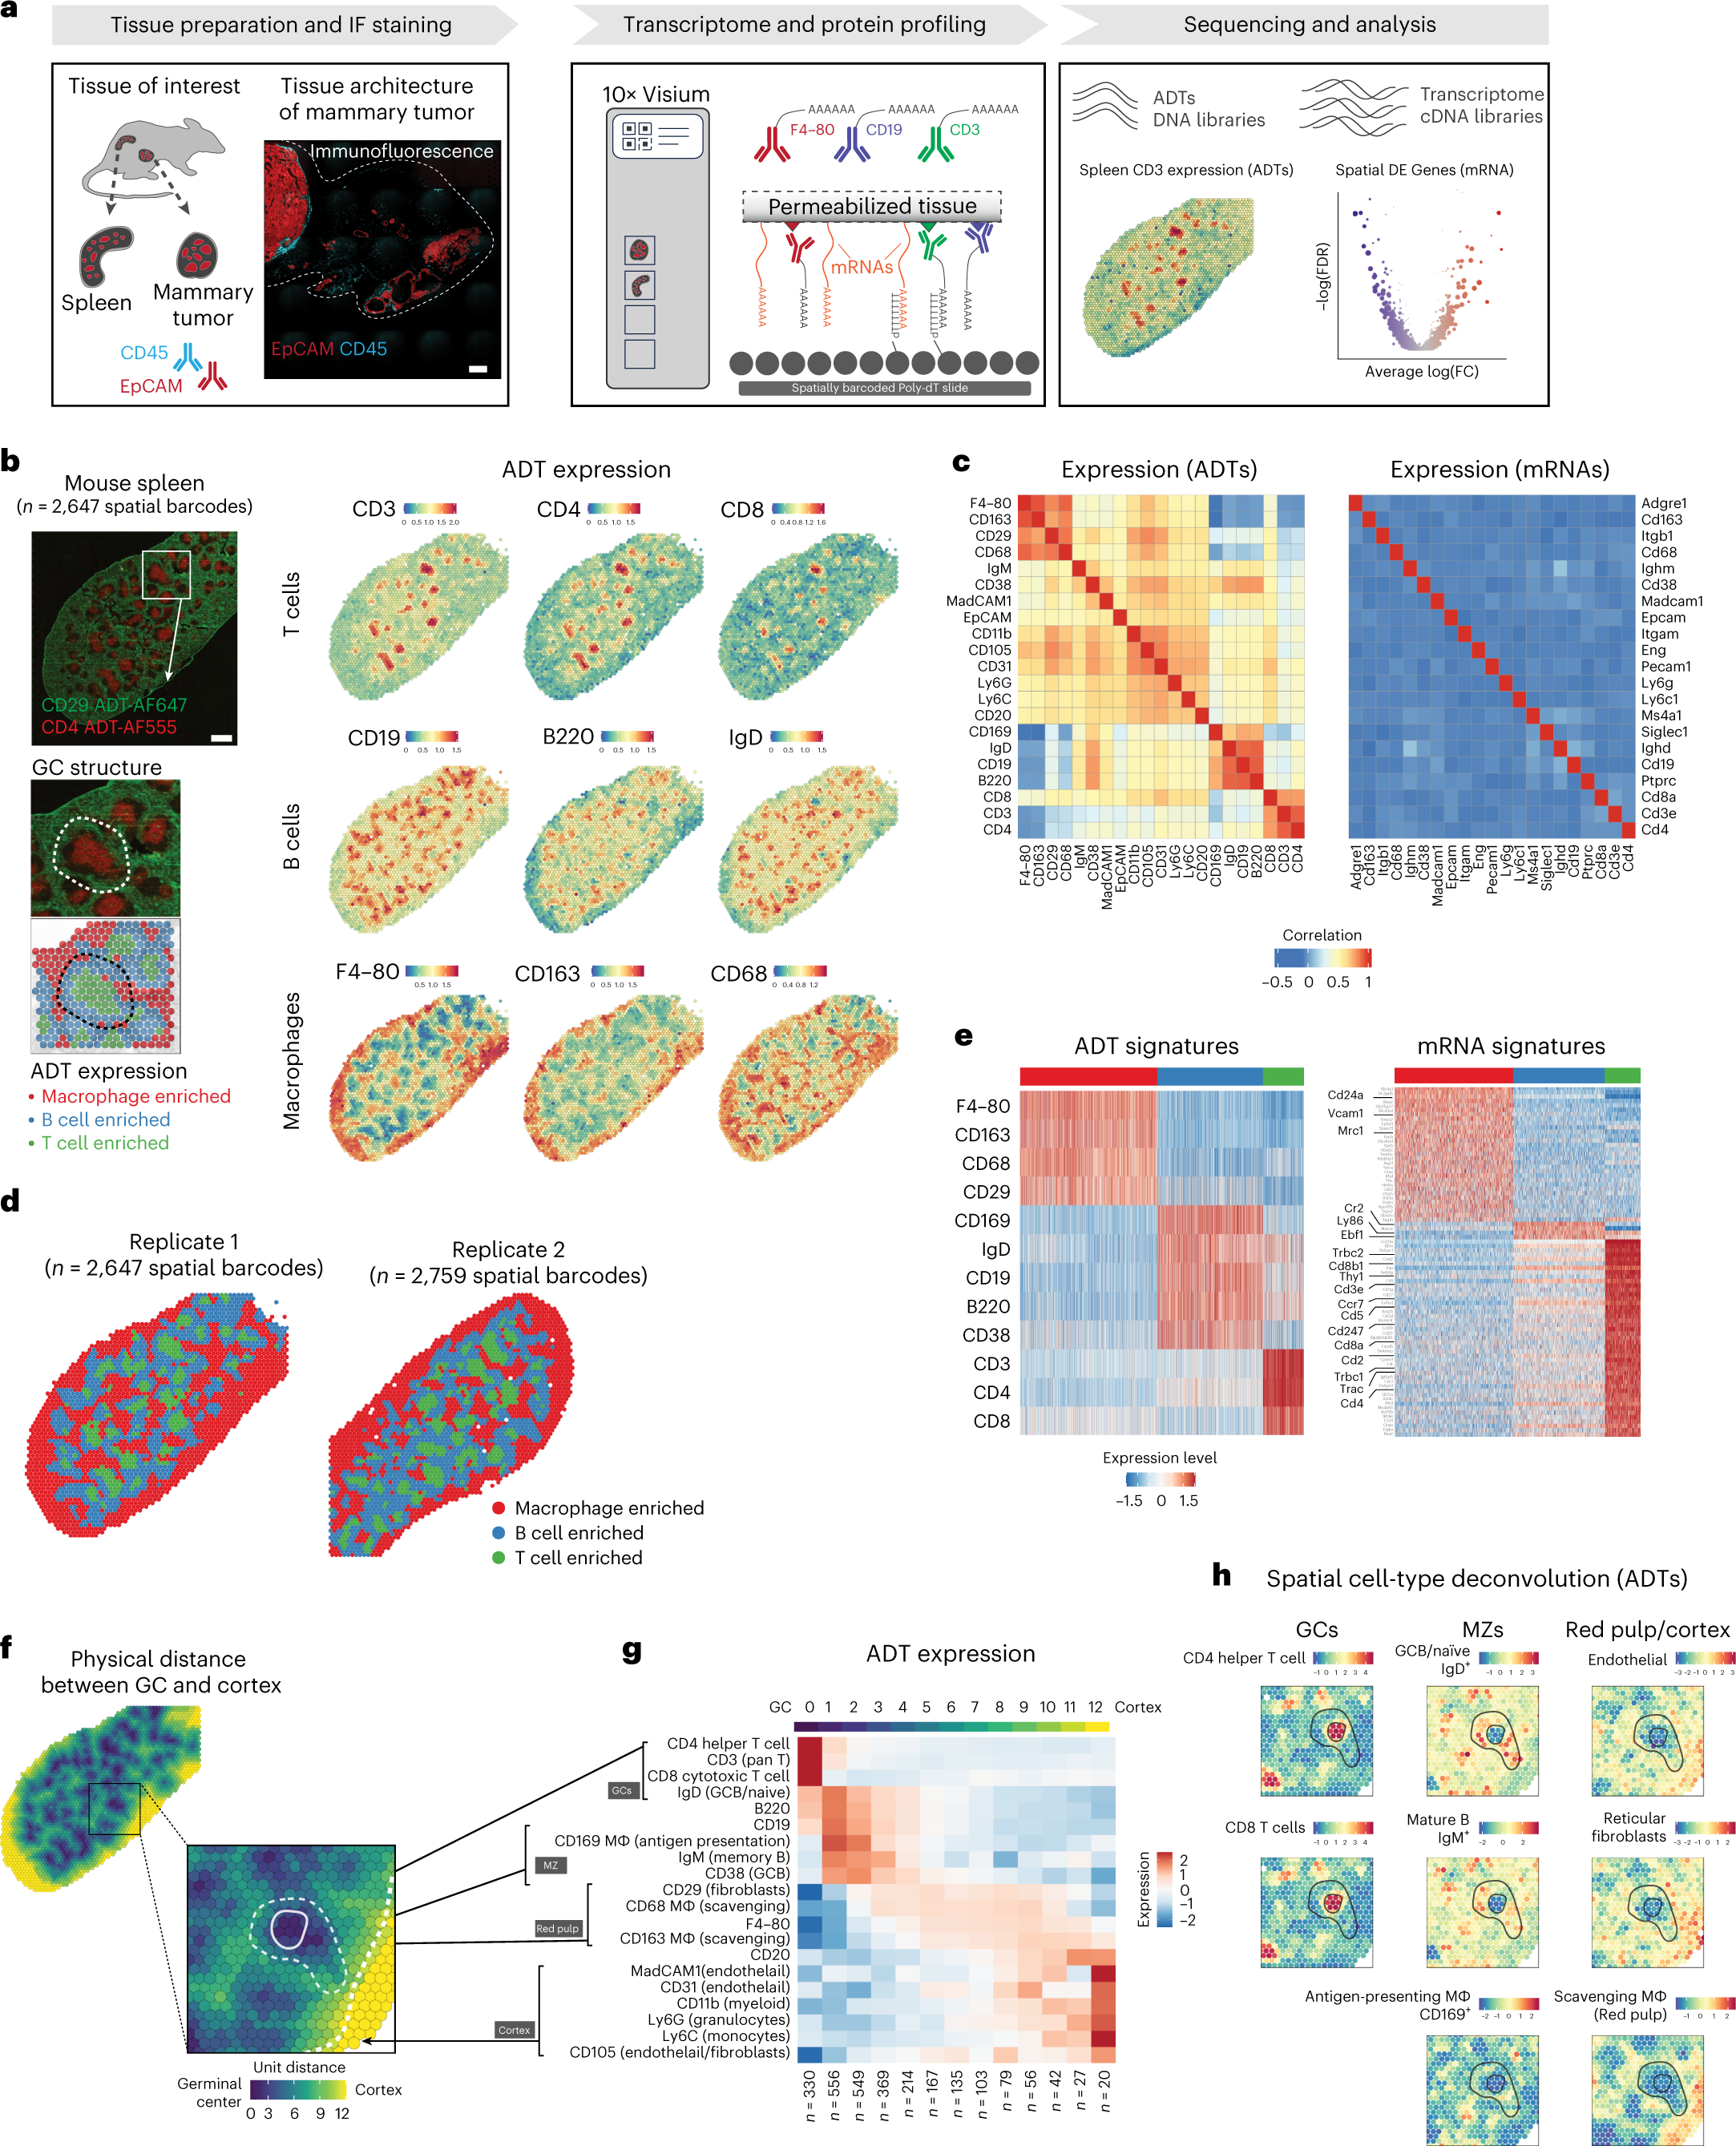
a, Overview of SPOTS workflow outline. Fresh tissue samples were collected and embedded in OCT. Tissue sections (10 μm) were processed following the SPOTS protocol (including staining with fluorescent and ADT antibodies, permeabilization, mRNA capture, reverse transcription and second-strand synthesis) and sequenced for downstream analysis. Scale bar, 500 μm. b, Normalized ADT levels of key surface markers for mouse spleen. Left, IF staining for CD29 (green) and CD4 (red) with inset showing the GC architecture and its underlying spatial barcodes. Right, normalized ADT levels of marker genes for T cells (CD3, CD4 and CD8), B cells (CD19, B220 and IgD) and macrophages (F4–80, CD163 and CD68). Scale bar, 800 μm. c, Correlation between the 21 ADTs and their corresponding mRNA expression levels across two biological replicates. d, Spatial barcode clustering and major cell-type enrichment (macrophage (Mφ), B cell and T cell) based on ADTs of two biological replicates. e, ADT and mRNA signatures for each cluster of spatial barcodes. Left, heatmap showing expression levels (z-score) of differentially expressed ADTs for each cluster. Right, heatmap showing expression levels (z-score) of differentially expressed mRNAs in 3,000 downsampled spatial barcodes. Key marker genes are highlighted. f, Physical distance (color scale) from the center of GCs for each spatial barcode. g, Spatial gene expression patterns of ADTs in murine spleens (n = 2). ADT expression pattern (z-score) from GC to spleen cortex and their anatomical definition (black boxes). The top color bar represents the physical distance as in the right panel. The number of spatial barcodes in each bin is labeled at the bottom. h, Cell-type deconvolution based on ADT expression (z-score) of each spatial barcode overlaid on to the spleen tissue.
Ben-Chetrit N, Niu X, Swett AD, Sotelo J, Jiao MS, Stewart CM, Potenski C, Mielinis P, Roelli P, Stoeckius M, Landau DA. (2023) Integration of whole transcriptome spatial profiling with protein markers. Nat Biotechnol [Epub ahead of print]. [abstract]


