

Transposable Elements (TEs) contribute to the repetitive fraction in almost every eukaryotic genome known to date, and their transcriptional activation can influence the expression of neighboring genes in healthy and disease states. Single cell RNA-Seq (scRNA-Seq) is a technical advance that allows the study of gene expression on a cell-by-cell basis. Although a current computational approach is available for the single cell analysis of TE expression, it omits their genomic location.
Researchers from the Icahn School of Medicine at Mount Sinai show SoloTE, a pipeline that outperforms the previous approach in terms of computational resources and by allowing the inclusion of locus-specific TE activity in scRNA-Seq expression matrixes. The researchers then apply SoloTE to several datasets to reveal the repertoire of TEs that become transcriptionally active in different cell groups, and based on their genomic location, they predict their potential impact on gene expression. As this tool takes as input the resulting files from standard scRNA-Seq processing pipelines, the researchers expect it to be widely adopted in single cell studies to help researchers discover patterns of cellular diversity associated with TE expression.
General comparison between SoloTE and scTE
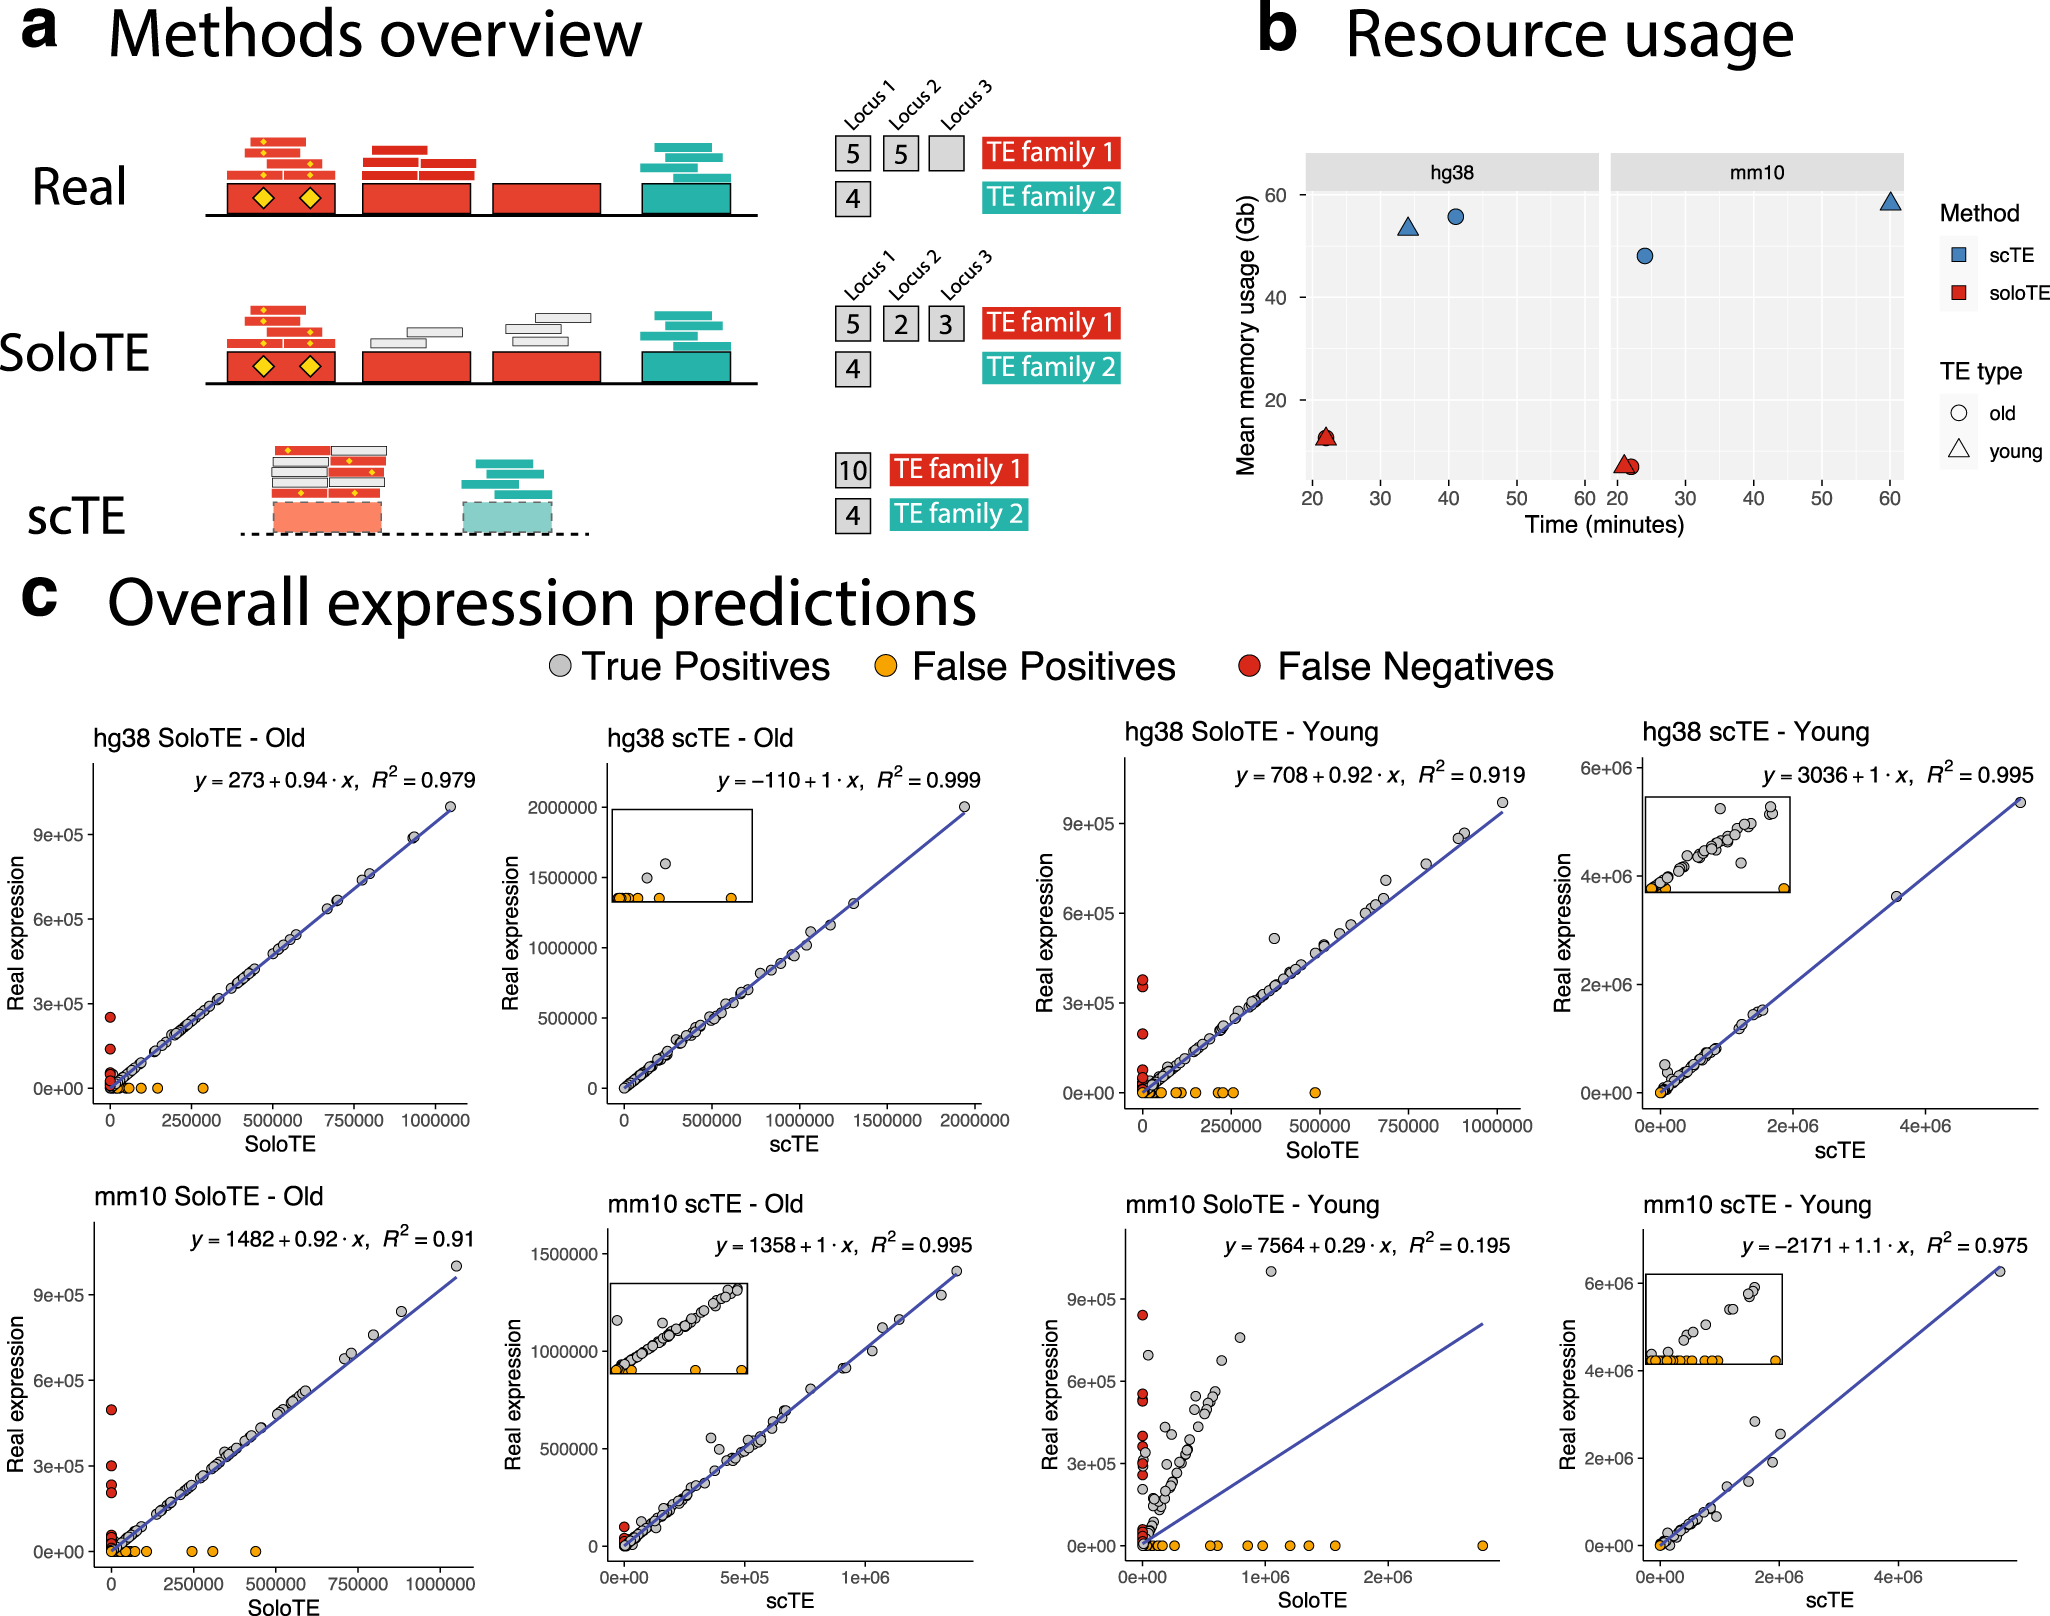
a Overview of the read assignment per TE of each method. Four TEs are depicted, with three of them belonging to “family 1” (in red) and the remaining one to “family 2” (in cyan). Yellow diamonds indicate sequence variations specific to a TE. The smaller rectangles above each TE correspond to reads assigned to that specific location, with small gray rectangles corresponding to multi-mapped reads. The counts to the right indicate how each method calculates TE expression. “Real”: the expected situation in which 2 TEs from family 1 are expressed, and 1 TE from family 2 is expressed. “SoloTE”: reads are assigned to each locus, with multi-mapped reads assigned to a random location. “scTE”: dashed rectangles indicate that reads are assigned to TE metagenes, and summarized by families. b Memory usage versus time plots of SoloTE and scTE using the datasets simulated in this work: left, simulated data from the human genome hg38 version; right, simulated data from the mouse genome mm10 version. Color indicates the method (scTE in blue, SoloTE in red), and the shape indicates the TE type (circle for Old TEs, and triangle for Young TEs). c Overall expression estimates (without cell demultiplexing) for each simulated dataset. First row corresponds to the comparisons using the hg38 datasets, and the second row to the comparisons using the mm10 datasets. In each plot, the x axis corresponds to the method used to estimate expression (SoloTE or scTE), and the y axis to the real TE expression. Points are colored according to whether they match an expressed TE (gray, “True Positive”), TE mistakenly reported as expressed (orange, “False Positive”), TE expressed but not detected by the method (red, “False Negative”). Inset plots were added to the scTE main plots to show the spread of false positive predictions.
Availability – SoloTE is publicly available at https://github.com/bvaldebenitom/SoloTE/
Rodríguez-Quiroz R, Valdebenito-Maturana B. (2022) SoloTE for improved analysis of transposable elements in single-cell RNA-Seq data using locus-specific expression. Commun Biol 5(1):1063. [article]


