

From c&en by Laura Howes
In 1918, people started getting sick. Really sick. A new strain of influenza had arrived, and it quickly spread, becoming a global pandemic that killed millions. Researchers have now pieced together the virus’s genetic code using samples from three people who died of the flu to uncover how the virus changed during the pandemic (Nat. Commun. 2022, DOI: 10.1038/s41467-022-29614-9).
When virologist Sébastien Calvignac-Spencer of the Robert Koch Institute visited the Berlin Museum of Medical History, he was looking for historical samples he could use to test how to extract viral information from preserved tissues. When he found lung samples from 1918 in the basement, he says, it seemed like a natural place to start. He wasn’t hopeful, but he assembled a team to look for preserved viral RNA. They found some.
The researchers managed to find and read flu RNA in 3 of the 13 specimens eventually tested. Two of those samples came from young soldiers who died in Berlin, and the other came from a young woman who died in Munich.
The researchers compared their new genomes to the only other known sequences of the 1918 flu—one from a woman buried in Alaskan permafrost and the other from a soldier in New York. They found that the genetic code for the 1918 flu changed considerably over time, altering key proteins like the RNA polymerase and the nucleoprotein. The team says these mutations might explain why the virus’s behavior changed during the pandemic. The sequences also suggest that the seasonal H1N1 flu descends from the 1918 pandemic strain.
Time-measured phylogenetic patterns and evolutionary rates estimated
using Bayesian molecular clock modeling
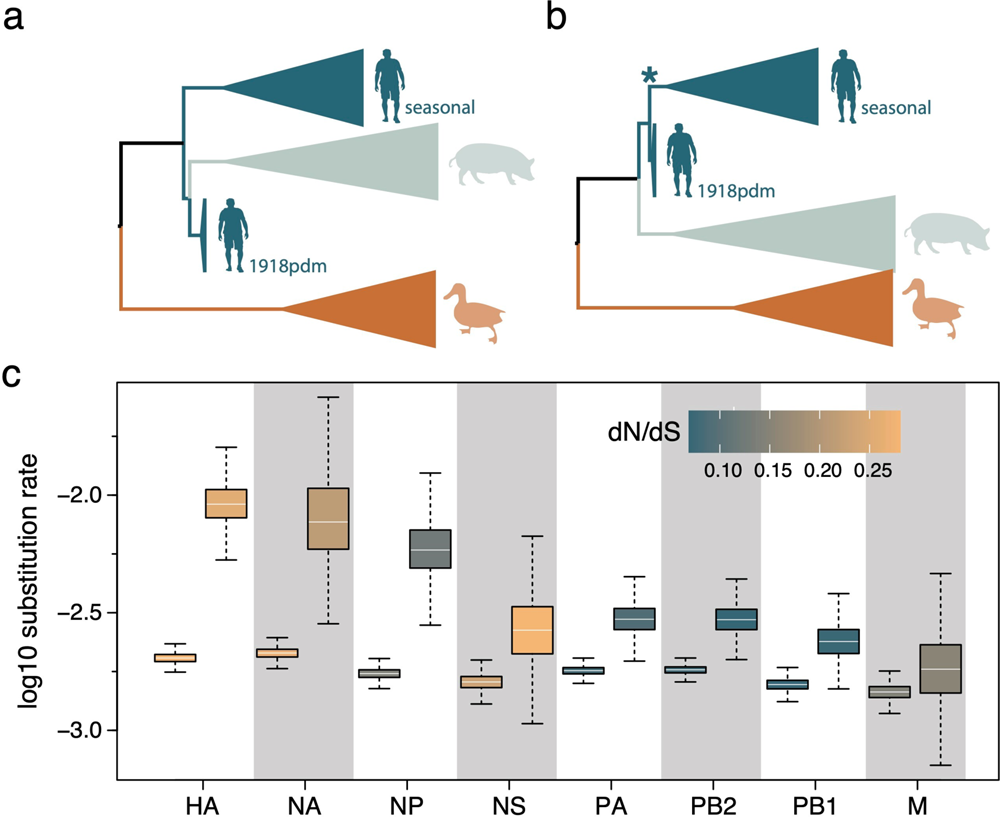
a The phylogenetic pattern for HA and NA inferred using a standard host-specific local clock (HSLC) model. b A monophyletic cluster for human pandemic and seasonal viruses estimated for HA and NA using an extended HSLC model (and using either model for all other segments). The star denotes the branch that is allowed to have a separate evolutionary rate in the HSLCext model. c Evolutionary rate estimates for the human lineage (first box) and the seasonal ancestral branch (second box) under the extended HSLC model for each segment ordered according to difference in these two rates. The boxes are colored according to the dN/dS estimate for the human lineage and the seasonal ancestral branch in each segment. The horizontal line in the whisker plots represents the mean. The lower and upper bounds of the boxes indicate the first and third quartile, respectively. Vertical lines are the upper and lower whisker representing the minimum of the largest value and 1.5 times the inter quartile distance, respectively the maximum of the smallest value and 1.5 times the inter quartile distance. Sample size from the MCMC chain is 2702 for NA and 4502 for all other segments. Source data are provided as a Source Data file.
Patrono LV, Vrancken B, Budt M, Düx A, Lequime S, Boral S, Gilbert MTP, Gogarten JF, Hoffmann L, Horst D, Merkel K, Morens D, Prepoint B, Schlotterbeck J, Schuenemann VJ, Suchard MA, Taubenberger JK, Tenkhoff L, Urban C, Widulin N, Winter E, Worobey M, Schnalke T, Wolff T, Lemey P, Calvignac-Spencer S. (2022) Archival influenza virus genomes from Europe reveal genomic variability during the 1918 pandemic. Nat Commun 13(1):2314. [article]


