

Multi-modal single cell RNA assays capture RNA content as well as other data modalities, such as spatial cell position or the electrophysiological properties of cells. Compared to dedicated scRNA-seq assays however, they may unintentionally capture RNA from multiple adjacent cells, exhibit lower RNA sequencing depth compared to scRNA-seq, or lack genome-wide RNA measurements. Researchers at the University of California, Davis have developed scProjection, a method for mapping individual multi-modal RNA measurements to deeply sequenced scRNA-seq atlases to extract cell type-specific, single cell gene expression profiles. The researchers demonstrate several use cases of scProjection, including identifying spatial motifs from spatial transcriptome assays, distinguishing RNA contributions from neighboring cells in both spatial and multi-modal single cell assays, and imputing expression measurements of un-measured genes from gene markers. scProjection therefore combines the advantages of both multi-modal and scRNA-seq assays to yield precise multi-modal measurements of single cells.
RNA projection and cell type abundance estimation with scProjection
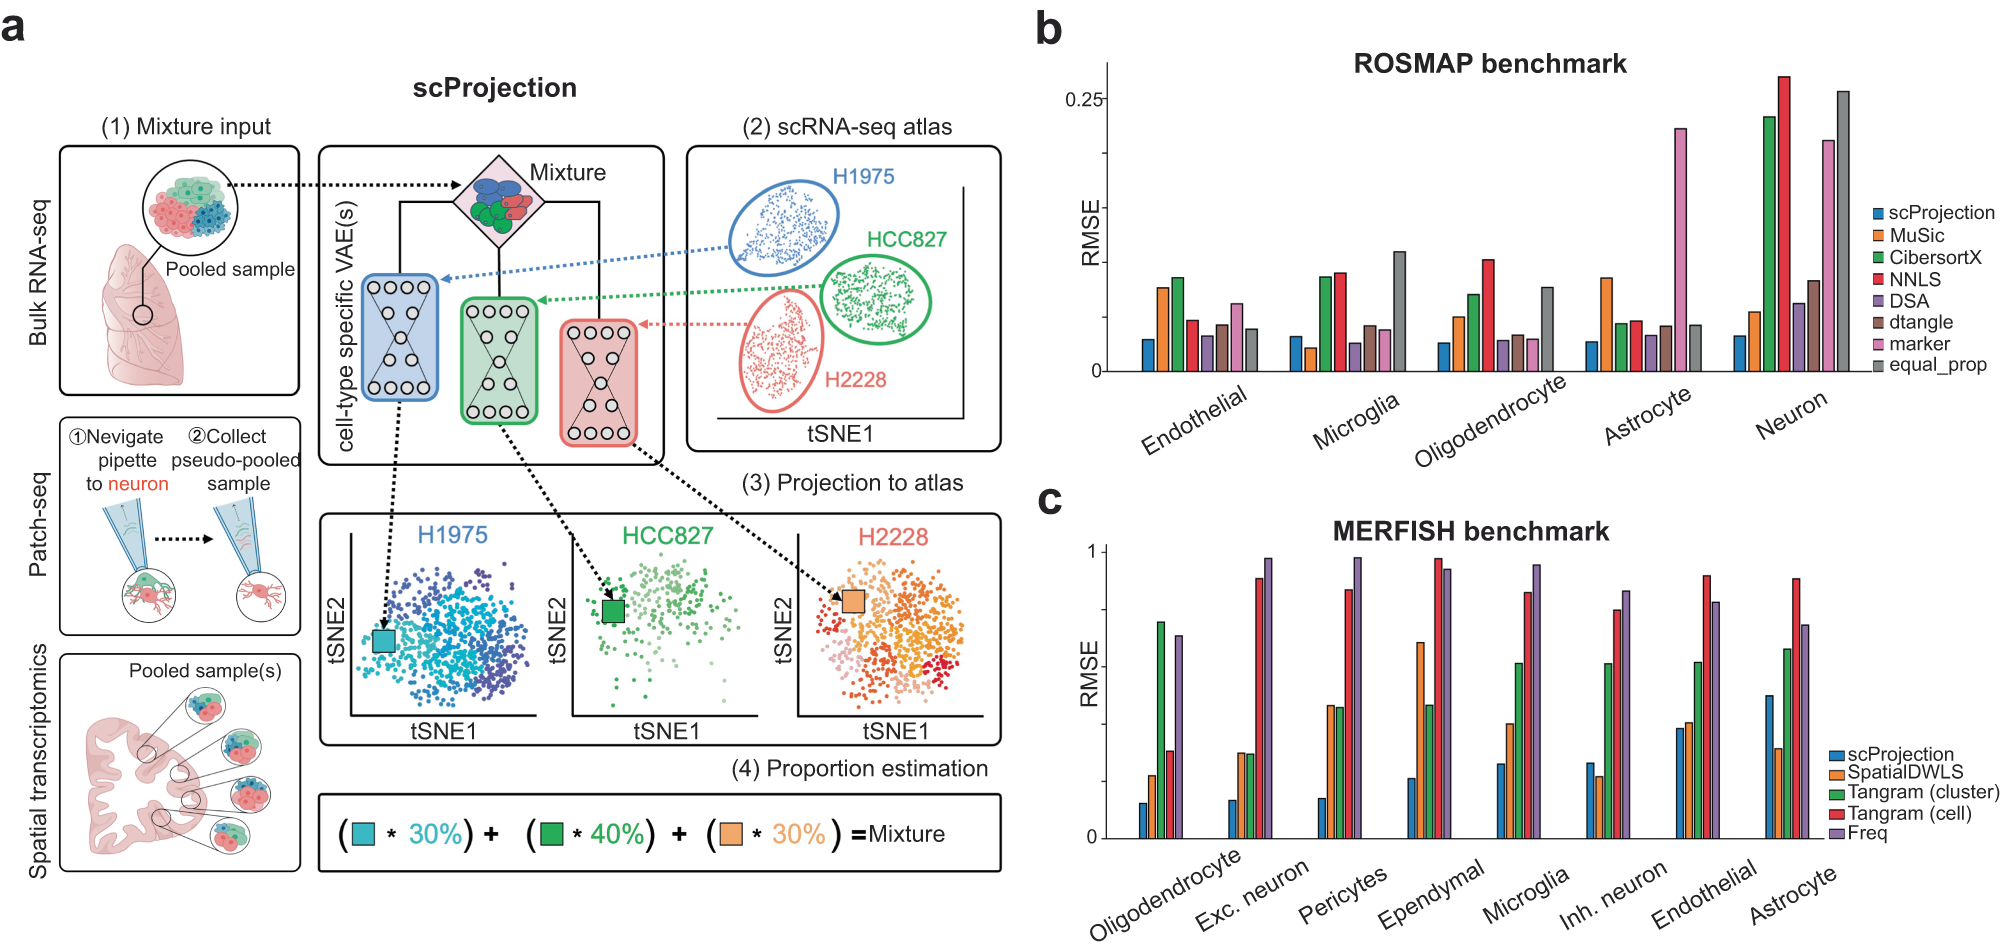
a (1) The primary input to scProjection consists of one or more RNA measurements originating from mixtures of cells assayed using bulk RNA-seq, multi-modal assays or spatial transcriptomics. (2) The secondary input to scProjection is a single-cell atlas from the same region or tissue as the mixture samples and contains the same cell types present in the mixture samples. For each of the annotated cell types in the single-cell atlas, a variational autoencoder is trained to capture within-cell type variation in expression. (3, 4) scProjection uses the variational autoencoder to extract cell type-specific contributions to each mixed sample, as well as the % RNA contribution of each of those cell types to the mixture. b Bar plots indicate the root-mean-square error (RMSE) in predicted cell type abundances for each deconvolution method on the ROSMAP (Patrick et al. 2020) benchmark data; grey bars represent the error of a baseline approach (equal_prop) of predicting equal RNA contributions from each cell type. c Bar plots indicate the RMSE in the estimated cell type proportion for each deconvolution method on the spatial transcriptome-based benchmarking data (Moffitt et al. 2018). Purple bars (Freq) represent the error of a baseline approach of predicting proportion based on the frequency of each cell type in the MERFISH RNA measurements, based on the original authors’ labels.
Availability – The scProjection framework was implemented in the ‘scProjection’ Python package, which can be installed through PyPI (https://pypi.org/project/scProjection/), and the code is available at https://github.com/quon-titative-biology/scProjection along with tutorials.
Johansen N, Hu H, Quon G. (2023) Projecting RNA measurements onto single cell atlases to extract cell type-specific expression profiles using scProjection. Nat Commun 14(1):5192. [article]


