Cellular omics such as single-cell genomics, proteomics, and microbiomics allow the characterization of tissue and microbial community composition, which can be compared between conditions to identify biological drivers. This strategy has been critical to revealing markers of disease progression, such as cancer and pathogen infection. A dedicated statistical method for differential variability analysis is lacking for cellular omics data, and existing methods for differential composition analysis do not model some compositional data properties, suggesting there is room to improve model performance.
Researchers from the Walter and Eliza Hall Institute of Medical Research have developed sccomp, a method for differential composition and variability analyses that jointly models data count distribution, compositionality, group-specific variability, and proportion mean-variability association, being aware of outliers. sccomp provides a comprehensive analysis framework that offers realistic data simulation and cross-study knowledge transfer. Here, the researchers demonstrate that mean-variability association is ubiquitous across technologies, highlighting the inadequacy of the very popular Dirichlet-multinomial distribution. They show that sccomp accurately fits experimental data, significantly improving performance over state-of-the-art algorithms. Using sccomp, they identified differential constraints and composition in the microenvironment of primary breast cancer.
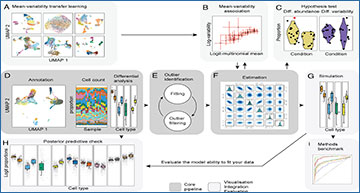
sccomp core algorithm, data integration, and visualization
(A) Integrating existing single-cell compositional studies gives prior information on the proportion mean–variability association (Cross-dataset learning transfer in Methods). (B) Representation of the association between proportion means and variability (Statistical model in Methods). (C) An example of the difference in cell-group abundance (left-hand side) and variability (right-hand side) that sccomp can estimate (Differential variability analysis in Methods). (D) Representation of the process from cell clustering and counting that is the input for the differential composition analysis (User interface in Methods). (E) Schematic of the iterative process of outlier identification and exclusion (Iterative outlier detection in Methods). (F) Illustration of the posterior probability distribution of regression coefficients from the model fitting (Hypothesis testing in Methods). (G) Data simulation from the fitted model. (H) Posterior predictive check simulates data under the fitted model and then compares these to the observed data (Posterior predictive check, Methods). This check allows users to evaluate the ability of the model to fit a specific input dataset. (I) Representation of benchmarking with realistic data that sccomp allows in a user-friendly way.
Availability – The method sccomp, and the code used to generate figures and perform analyses have been deposited at: https://github.com/stemangiola/sccomp
Mangiola S, Roth-Schulze AJ, Trussart M, Zozaya-Valdés E, Ma M, Gao Z, Rubin AF, Speed TP, Shim H, Papenfuss AT. (2023) sccomp: Robust differential composition and variability analysis for single-cell data. PNAS 120(33):e2203828120. [article]


