

RNA structure is critical for multiple steps in gene regulation. However, how the structures of transcripts differ both within and between individual cells is unknown. Researchers at the A*STAR, Singapore have developed a SHAPE-inspired method called single-cell structure probing of RNA transcripts that enables simultaneous determination of transcript secondary structure and abundance at single-cell resolution. The researchers apply single-cell structure probing of RNA transcripts to human embryonic stem cells and differentiating neurons. Remarkably, RNA structure is more homogeneous in human embryonic stem cells compared with neurons, with the greatest homogeneity found in coding regions. More extensive heterogeneity is found within 3′ untranslated regions and is determined by specific RNA-binding proteins. Overall RNA structure profiles better discriminate cell type identity and differentiation stage than gene expression profiles alone. The researchers further discover a cell-type variable region of 18S ribosomal RNA that is associated with cell cycle and translation control. This method opens the door to the systematic characterization of RNA structure–function relationships at single-cell resolution.
Development of sc-SPORT to probe RNA structures in single cells
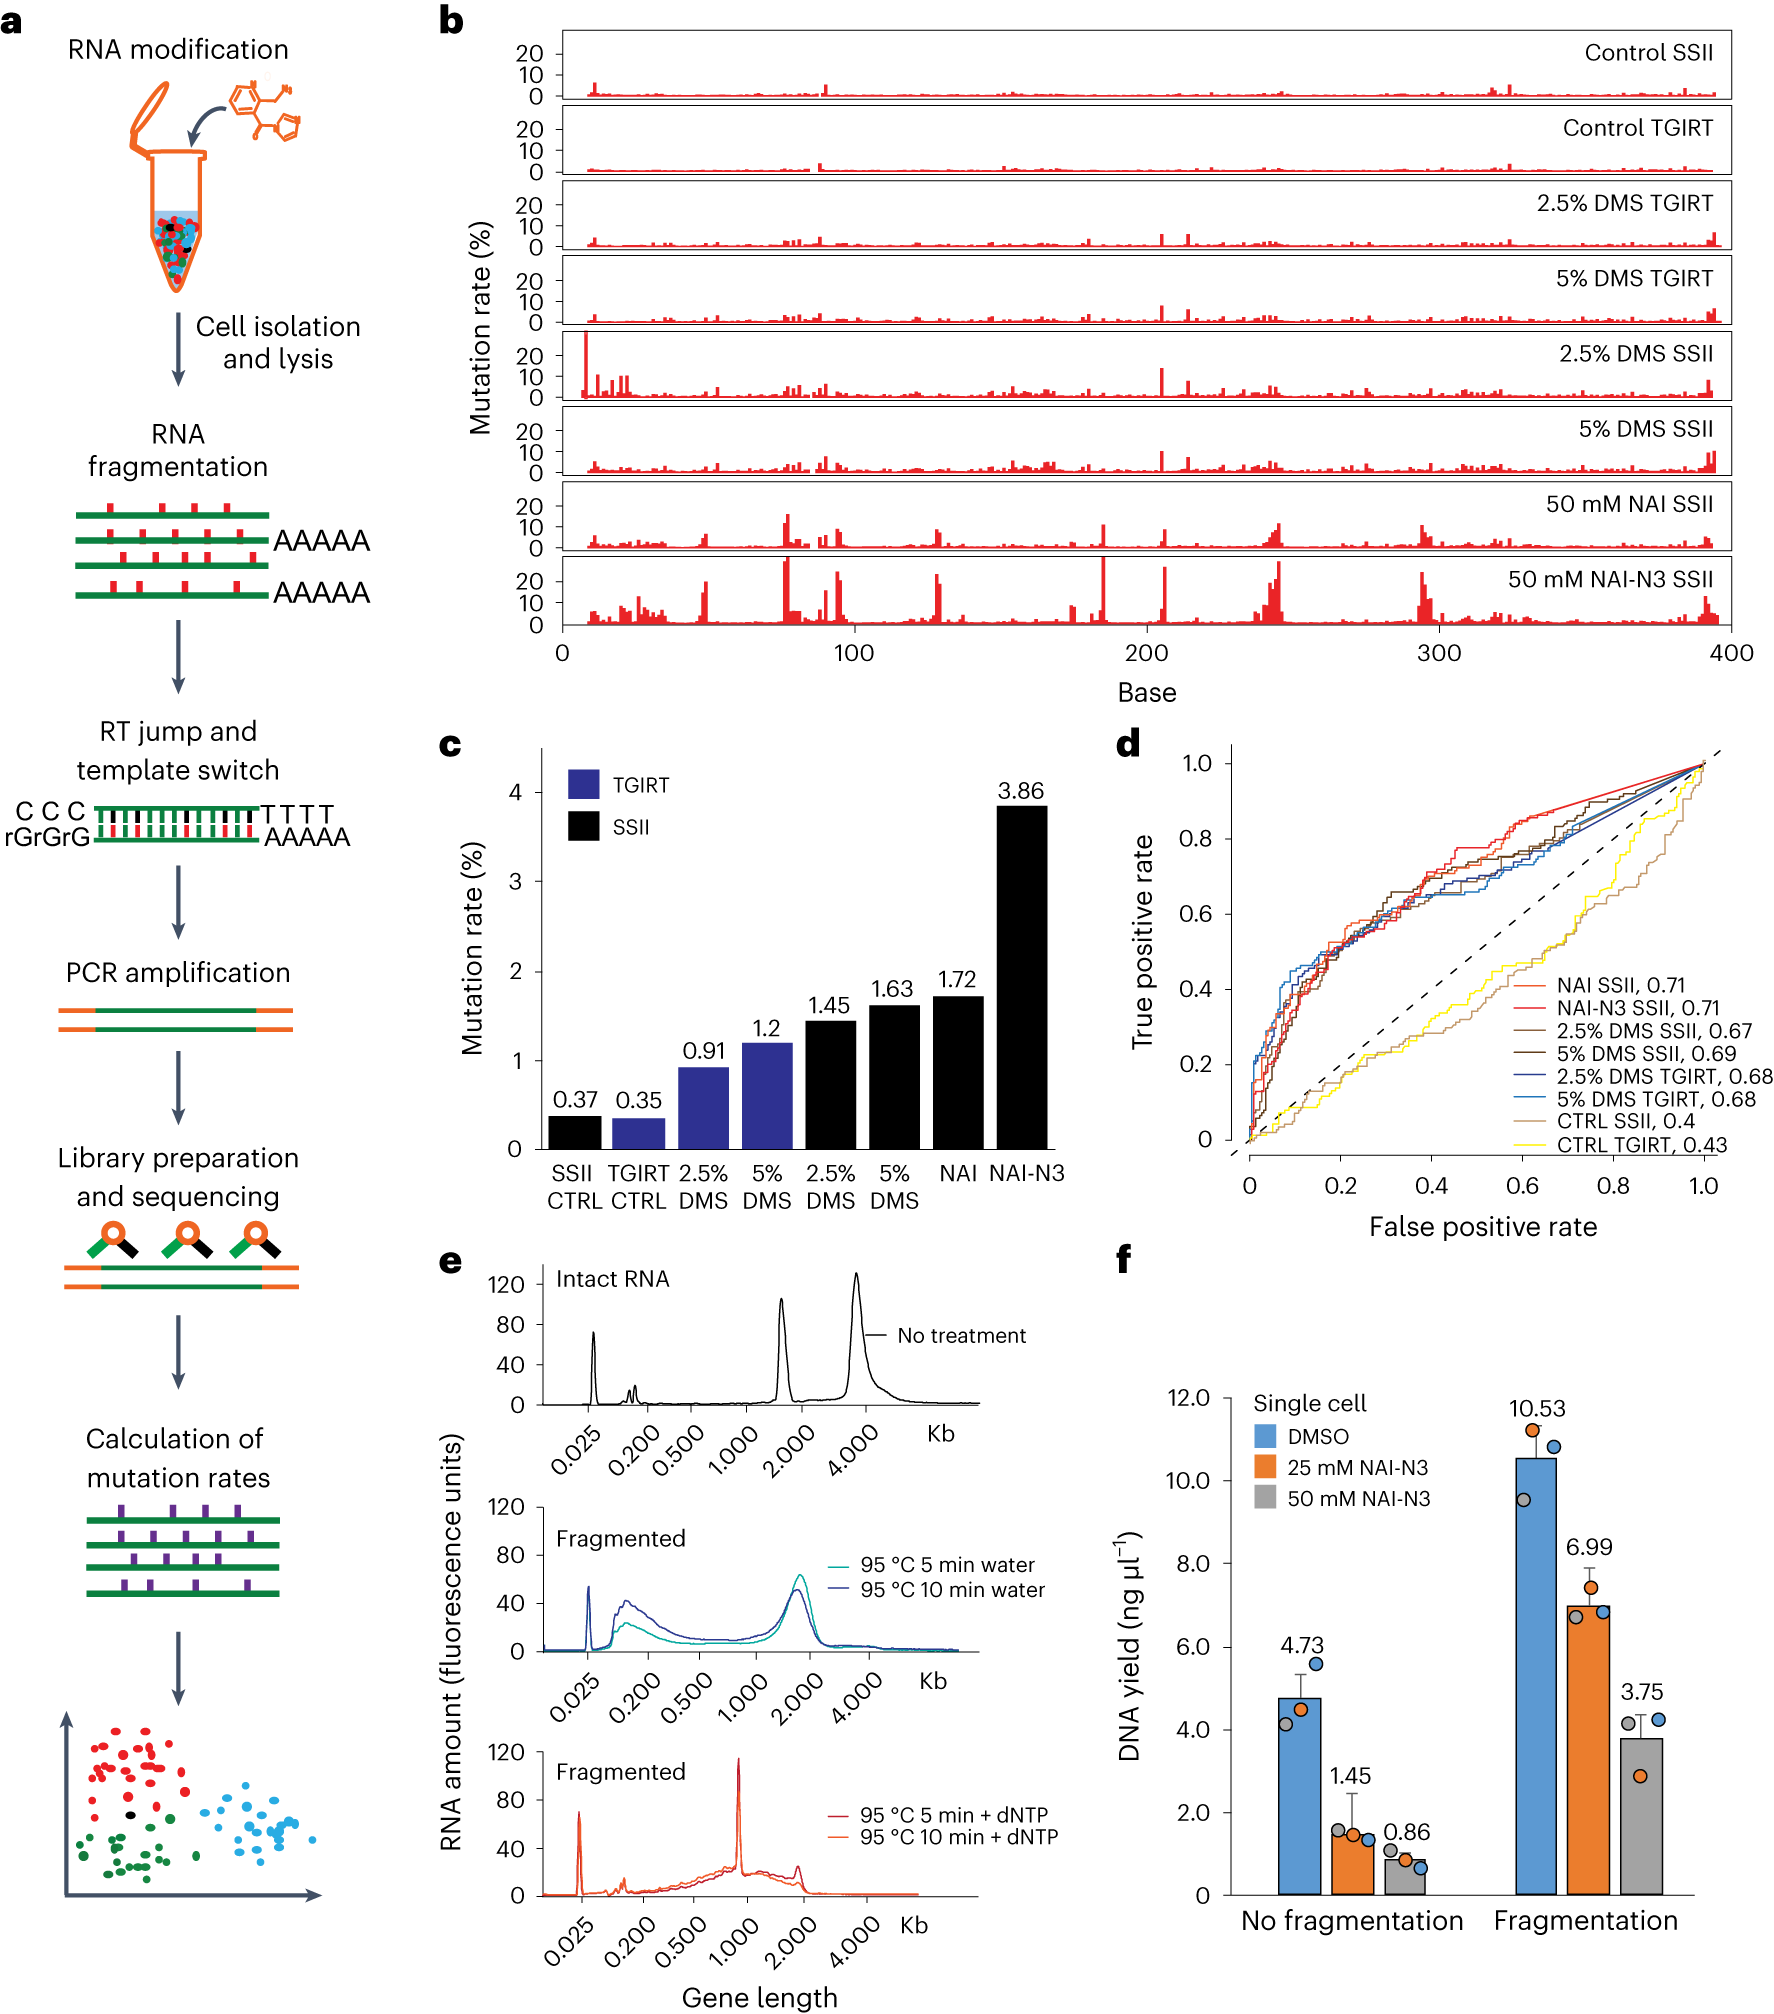
a, Experimental workflow of library preparation of sc-SPORT. b, Bar plots showing detected mutation rates on the Tetrahymena ribozyme using different RT enzymes (SSII and TGIRT) and different RNA modification compounds (DMS, NAI and NAI-N3) at different concentrations. c, A bar plot showing the average mutation rates along single-stranded regions of Tetrahymena ribozyme upon different treatments in b. d, ROC curves showing the accuracy of different treatments against the known secondary structure of Tetrahymena ribozyme. e, Bioanalyzer plots showing the size distribution of untreated RNA (top), RNA fragmented in water (middle) and RNA fragmented in water in the presence of 1 mM dNTP (bottom). f, Bar plots showing the amount of DNA that is generated from PCR amplification in single cells before (left) and after fragmentation (right) and in the presence of different concentrations of NAI-N3. The center represents the mean, and the error bars show the standard deviation. N = 3 biological replicates.
Availability – Analysis code is available at https://github.com/noahpieta/scSports.
Wang J, Zhang Y, Zhang T, Tan WT, Lambert F, Darmawan J, Huber R, Wan Y. (2024) RNA structure profiling at single-cell resolution reveals new determinants of cell identity. Nat Methods [Epub ahead of print]. [article]


