High-throughput omics technologies have generated a wealth of large protein, gene, and transcript datasets that have exacerbated the need for new methods to analyse and compare big datasets. Rank-rank hypergeometric overlap is an important threshold-free method to combine and visualize two ranked lists of P-values or fold-changes, usually from differential gene expression analyses.
Researchers at the Université Libre de Bruxelles have developed a new rank-rank hypergeometric overlap-based method aimed at gene level and alternative splicing analyses at transcript or exon level, hitherto unreachable as transcript numbers are an order of magnitude larger than gene numbers. The researchers tested the tool on synthetic and real datasets at gene and transcript levels to detect correlation and anticorrelation patterns and found it to be fast and accurate, even on very large datasets thanks to an evolutionary algorithm-based minimal P-value search. The tool comes with a ready-to-use permutation scheme allowing the computation of adjusted P-values at low time cost. The package compatibility mode is a drop-in replacement to previous packages. RedRibbon holds the promise to accurately extricate detailed information from large comparative analyses.
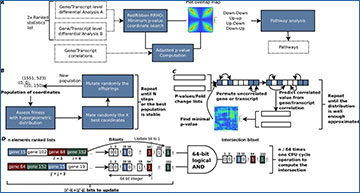
RedRibbon rank–rank hypergeometric overlap (RRHO) workflow, algorithms, and data structures
(A) Transcript level differential analysis by RRHO. The RedRibbon RRHO package can handle very large data because of improved data structures and algorithms (see benchmark). Transcript level differential analyses can be overlapped with a permutation scheme to correct P-values. The overlap analysis is followed by a pathway analysis. (B) The evolutionary algorithm will find the minimal P-value among coordinates. The best fitness individuals of a population of coordinates are mated and then randomly mutated to obtain a new population. This process is repeated until stability is reached among the best population or a fixed number of steps. (C) Hybrid prediction–permutation method to compute the adjusted minimal P-value. A set of uncorrelated elements (genes, transcripts; shown in blue squares) is identified. Their value (P-value or fold change) is permuted. The remaining correlated elements of the lists are predicted from this set with a linear model. The minimal RRHO P-value is then computed for the two permutated lists. The operation is repeated a fixed number of times and the adjusted P-value assessed. (D) The bitset data structure to compute intersection of gene sets for the ranked lists at coordinate (i,j). The ranked lists are converted into vectors of bits (bitsets) using the indexes of the genes. The bit at position k is set to one if gene k is before the index i or j in the ranked lists, otherwise the bit is set to zero. If a previous intersection has already been computed for coordinate (i’,j’), the bitsets are only updated for the genes added or removed to reach the coordinate (i,j). The intersection is computed with 64-bit logical AND operations.
Availability – The C libraries and R package code are available for download from GitHub https://github.com/antpiron/RedRibbon and https://github.com/antpiron/cRedRibbon.
Piron A, Szymczak F, Papadopoulou T, Alvelos MI, Defrance M, Lenaerts T, Eizirik DL, Cnop M. (2023) RedRibbon: A new rank-rank hypergeometric overlap for gene and transcript expression signatures. Life Sci Alliance 7(2):e202302203. [article]


