

Single-cell and single-nucleus RNA-sequencing (sxRNA-seq) is increasingly being used to characterise the transcriptomic state of cell types at homeostasis, during development and in disease. However, this is a challenging task, as biological effects can be masked by technical variation. Researchers at the University of Southern Denmark have developed JOINTLY, an algorithm enabling joint clustering of sxRNA-seq datasets across batches. JOINTLY performs on par or better than state-of-the-art batch integration methods in clustering tasks and outperforms other intrinsically interpretable methods. The researchers demonstrate that JOINTLY is robust against over-correction while retaining subtle cell state differences between biological conditions and highlight how the interpretation of JOINTLY can be used to annotate cell types and identify active signalling programs across cell types and pseudo-time. Finally, the researchers use JOINTLY to construct a reference atlas of white adipose tissue (WATLAS), an expandable and comprehensive community resource, in which they describe four adipocyte subpopulations and map compositional changes in obesity and between depots.
JOINTLY clusters single-cell RNA-seq and single-nucleus RNA-seq
(sxRNA-seq) datasets without explicit integration
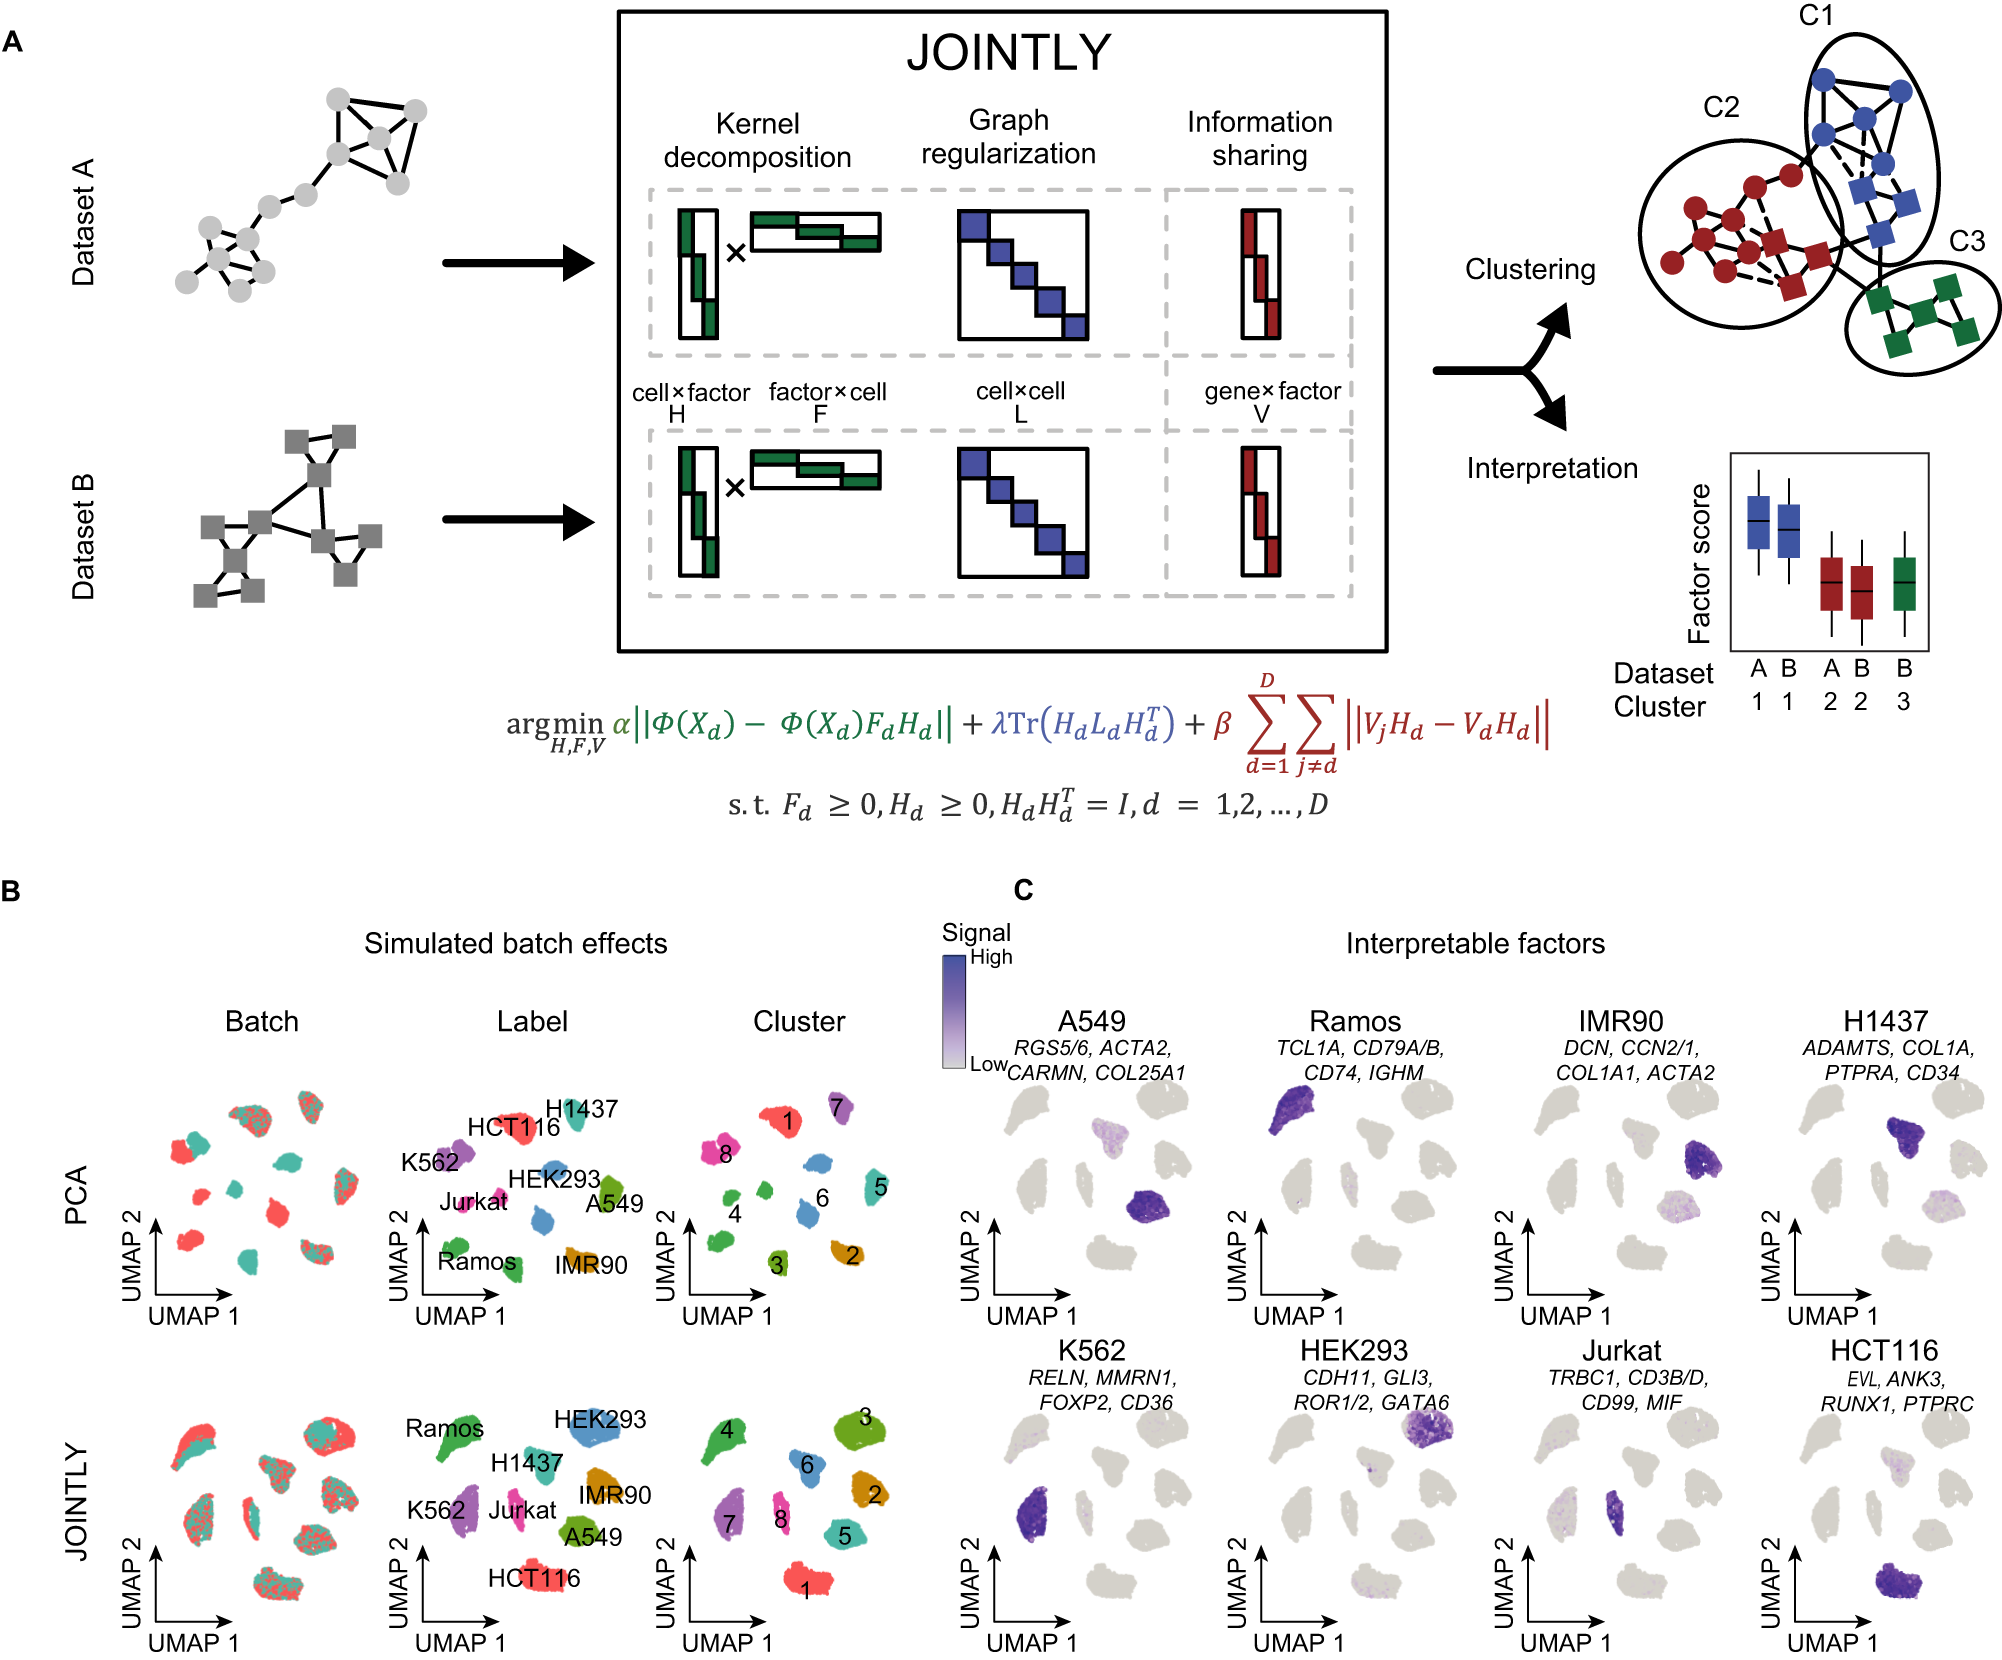
A Schematic illustration of JOINTLY. JOINTLY uses a hybrid linear and non-linear non-negative matrix factorisation to optimise reduced dimensional spaces, which allows for clustering across datasets and interpretation to discover conserved and active biological processes. The gene expression matrix (X) for each dataset (d in D) is decomposed into lower rank matrices (H and F) in a mapped higher or infinitely dimensional space (Φ). Graph regularisation is applied using the graph Laplacian L. Interpretable factors V constrain JOINTLY to patterns that are generalisable across datasets. Subject to (s.t.) non-negativity constraints on the F and H matrix. Tr is the trace matrix. I is the identity matrix. B, C UMAP for 8 cell lines with simulated batch effects (see “Methods”) based on reduced dimensional spaces calculated using PCA or JOINTLY. The UMAPs are coloured by batch, cell line, and cluster (B) or by selected gene modules derived from the interpretation JOINTLY (C).
Availability – JOINTLY is available as an R package on GitHub (http://www.github.com/madsen-lab/rJOINTLY) and Zenodo under https://doi.org/10.5281/zenodo.10159672.
White adipose tissue atlas (WATLAS) is available at: https://singlecell.broadinstitute.org/single_cell/study/SCP2289/a-single-cell-atlas-of-human-and-mouse-white-adipose-tissue
Møller AF, Madsen JGS. (2023) JOINTLY: interpretable joint clustering of single-cell transcriptomes. Nat Commun 14(1):8473. [article]


