

Oxidative modification of 5-methylcytosine (5mC) by ten-eleven translocation (TET) DNA dioxygenases generates 5-hydroxymethylcytosine (5hmC), the most abundant form of oxidized 5mC. Existing single-cell bisulfite sequencing methods cannot resolve 5mC and 5hmC, leaving the cell-type-specific regulatory mechanisms of TET and 5hmC largely unknown. Researchers at the University of Pennsylvania have developed joint single-nucleus (hydroxy)methylcytosine sequencing (Joint-snhmC-seq), a scalable and quantitative approach that simultaneously profiles 5hmC and true 5mC in single cells by harnessing differential deaminase activity of APOBEC3A toward 5mC and chemically protected 5hmC. Joint-snhmC-seq profiling of single nuclei from mouse brains reveals an unprecedented level of epigenetic heterogeneity of both 5hmC and true 5mC at single-cell resolution. The researchers show that cell-type-specific profiles of 5hmC or true 5mC improve multimodal single-cell data integration, enable accurate identification of neuronal subtypes and uncover context-specific regulatory effects on cell-type-specific genes by TET enzymes.
Joint-snhmC-seq workflow and performance
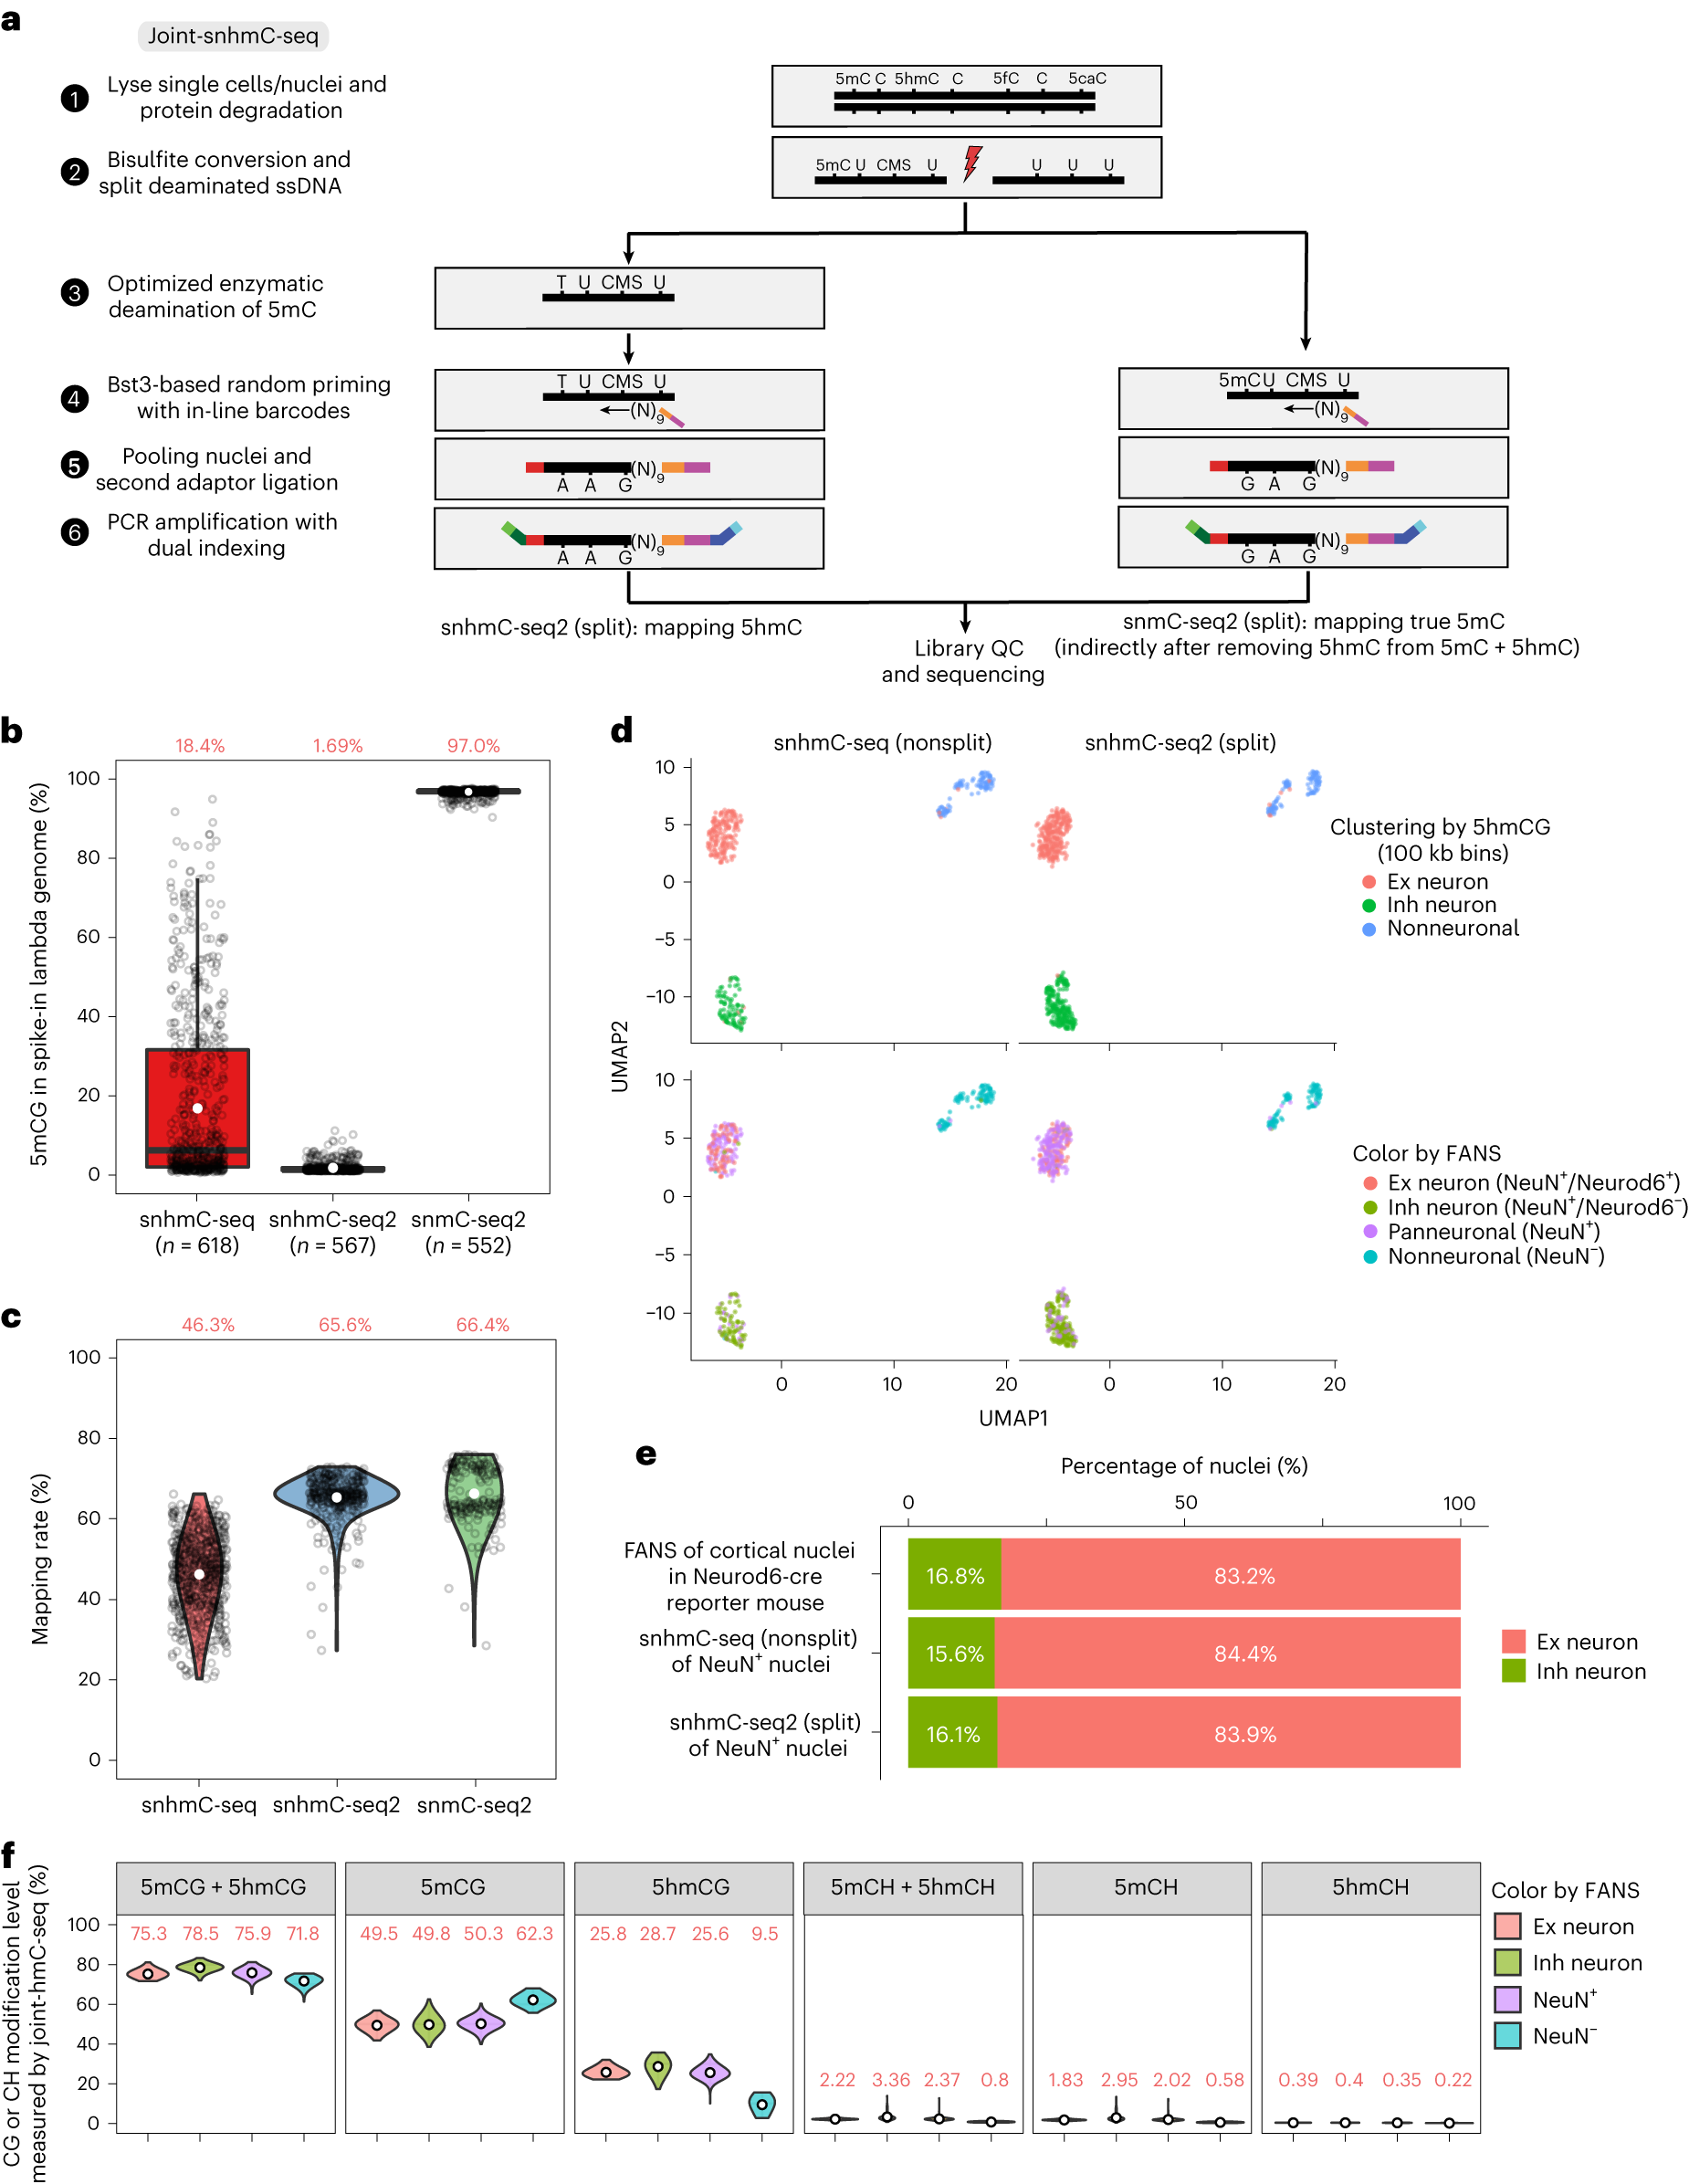
a, Schematic of the Joint-snhmC-seq workflow. b, Boxplot illustrating a comparison of 5mCG nonconversion rate in lambda spike-in between snhmC-seq and snhmC-seq2/split, with snmC-seq2/split (bisulfite conversion only) serving as a negative control. The boxes display the median (center line) and interquartile range (from the 25th to 75th percentile), the whiskers represent 1.5 times the interquartile range and open white circles indicate the mean value. c, Violin plots representing a comparison of mapping rates among snhmC-seq (618 nuclei), snhmC-seq2/split (378 quality control (QC).high nuclei) and snmC-seq2/split (187 QC.high nuclei). Open white circles indicate mean value. d, UMAP visualization comparing snhmC-seq (nonsplit, 360 nuclei) versus snhmC-seq2 (5hmC modality in Joint-snhmC-seq, 565 nuclei) clustered mouse cortical nuclei colored by unsupervised cluster identity (top) or FANS sorting channel (bottom). NeuN−, nonneuronal cells and NeuN+, neuronal cells. e, Bar plots showing the percentage of Ex and Inh neurons identified by FANS (NeuN+/Neurod6+ 7,371 nuclei, NeuN+/Neurod6− 1,488 nuclei), snhmC-seq/nonsplit (NeuN+ 129 nuclei) or snhmC-seq2/split (NeuN+ 186 nuclei). f, Violin plots illustrating CG or CH modification (%) for Ex neurons (NeuN+/Neurod6+ 94 nuclei), Inh neurons (NeuN+/Neurod6− 182 nuclei), neuronal (NeuN+ 175 nuclei) and nonneuronal (NeuN− 94 nuclei) cells in CG and CH sequence contexts for 545 nuclei with paired high-quality snhmC-seq2/split and snmC-seq2/split datasets.
Fabyanic EB, Hu P, Qiu Q, Berríos KN, Connolly DR, Wang T, Flournoy J, Zhou Z, Kohli RM, Wu H. (2023) Joint single-cell profiling resolves 5mC and 5hmC and reveals their distinct gene regulatory effects. Nat Biotechnol [Epub ahead of print]. [article]


