

Cells collectively determine biological functions by communicating with each other-both through direct physical contact and secreted factors. Consequently, the local microenvironment of a cell influences its behavior, gene expression, and cellular crosstalk. Disruption of this microenvironment causes reciprocal changes in those features, which can lead to the development and progression of diseases. Hence, assessing the cellular transcriptome while simultaneously capturing the spatial relationships of cells within a tissue provides highly valuable insights into how cells communicate in health and disease. Yet, methods to probe the transcriptome often fail to preserve native spatial relationships, lack single-cell resolution, or are highly limited in throughput, i.e. lack the capacity to assess multiple environments simultaneously.
Researchers at ETH Zürich have developed fragment-sequencing (fragment-seq), a method that enables the characterization of single-cell transcriptomes within multiple spatially distinct tissue microenvironments. The researchers apply fragment-seq to a murine model of the metastatic liver to study liver zonation and the metastatic niche. This analysis reveals zonated genes and ligand-receptor interactions enriched in specific hepatic microenvironments. Finally, the researchers apply fragment-seq to other tissues and species, demonstrating the adaptability of their method.
Overview of fragment-seq and assessment of quality and accuracy
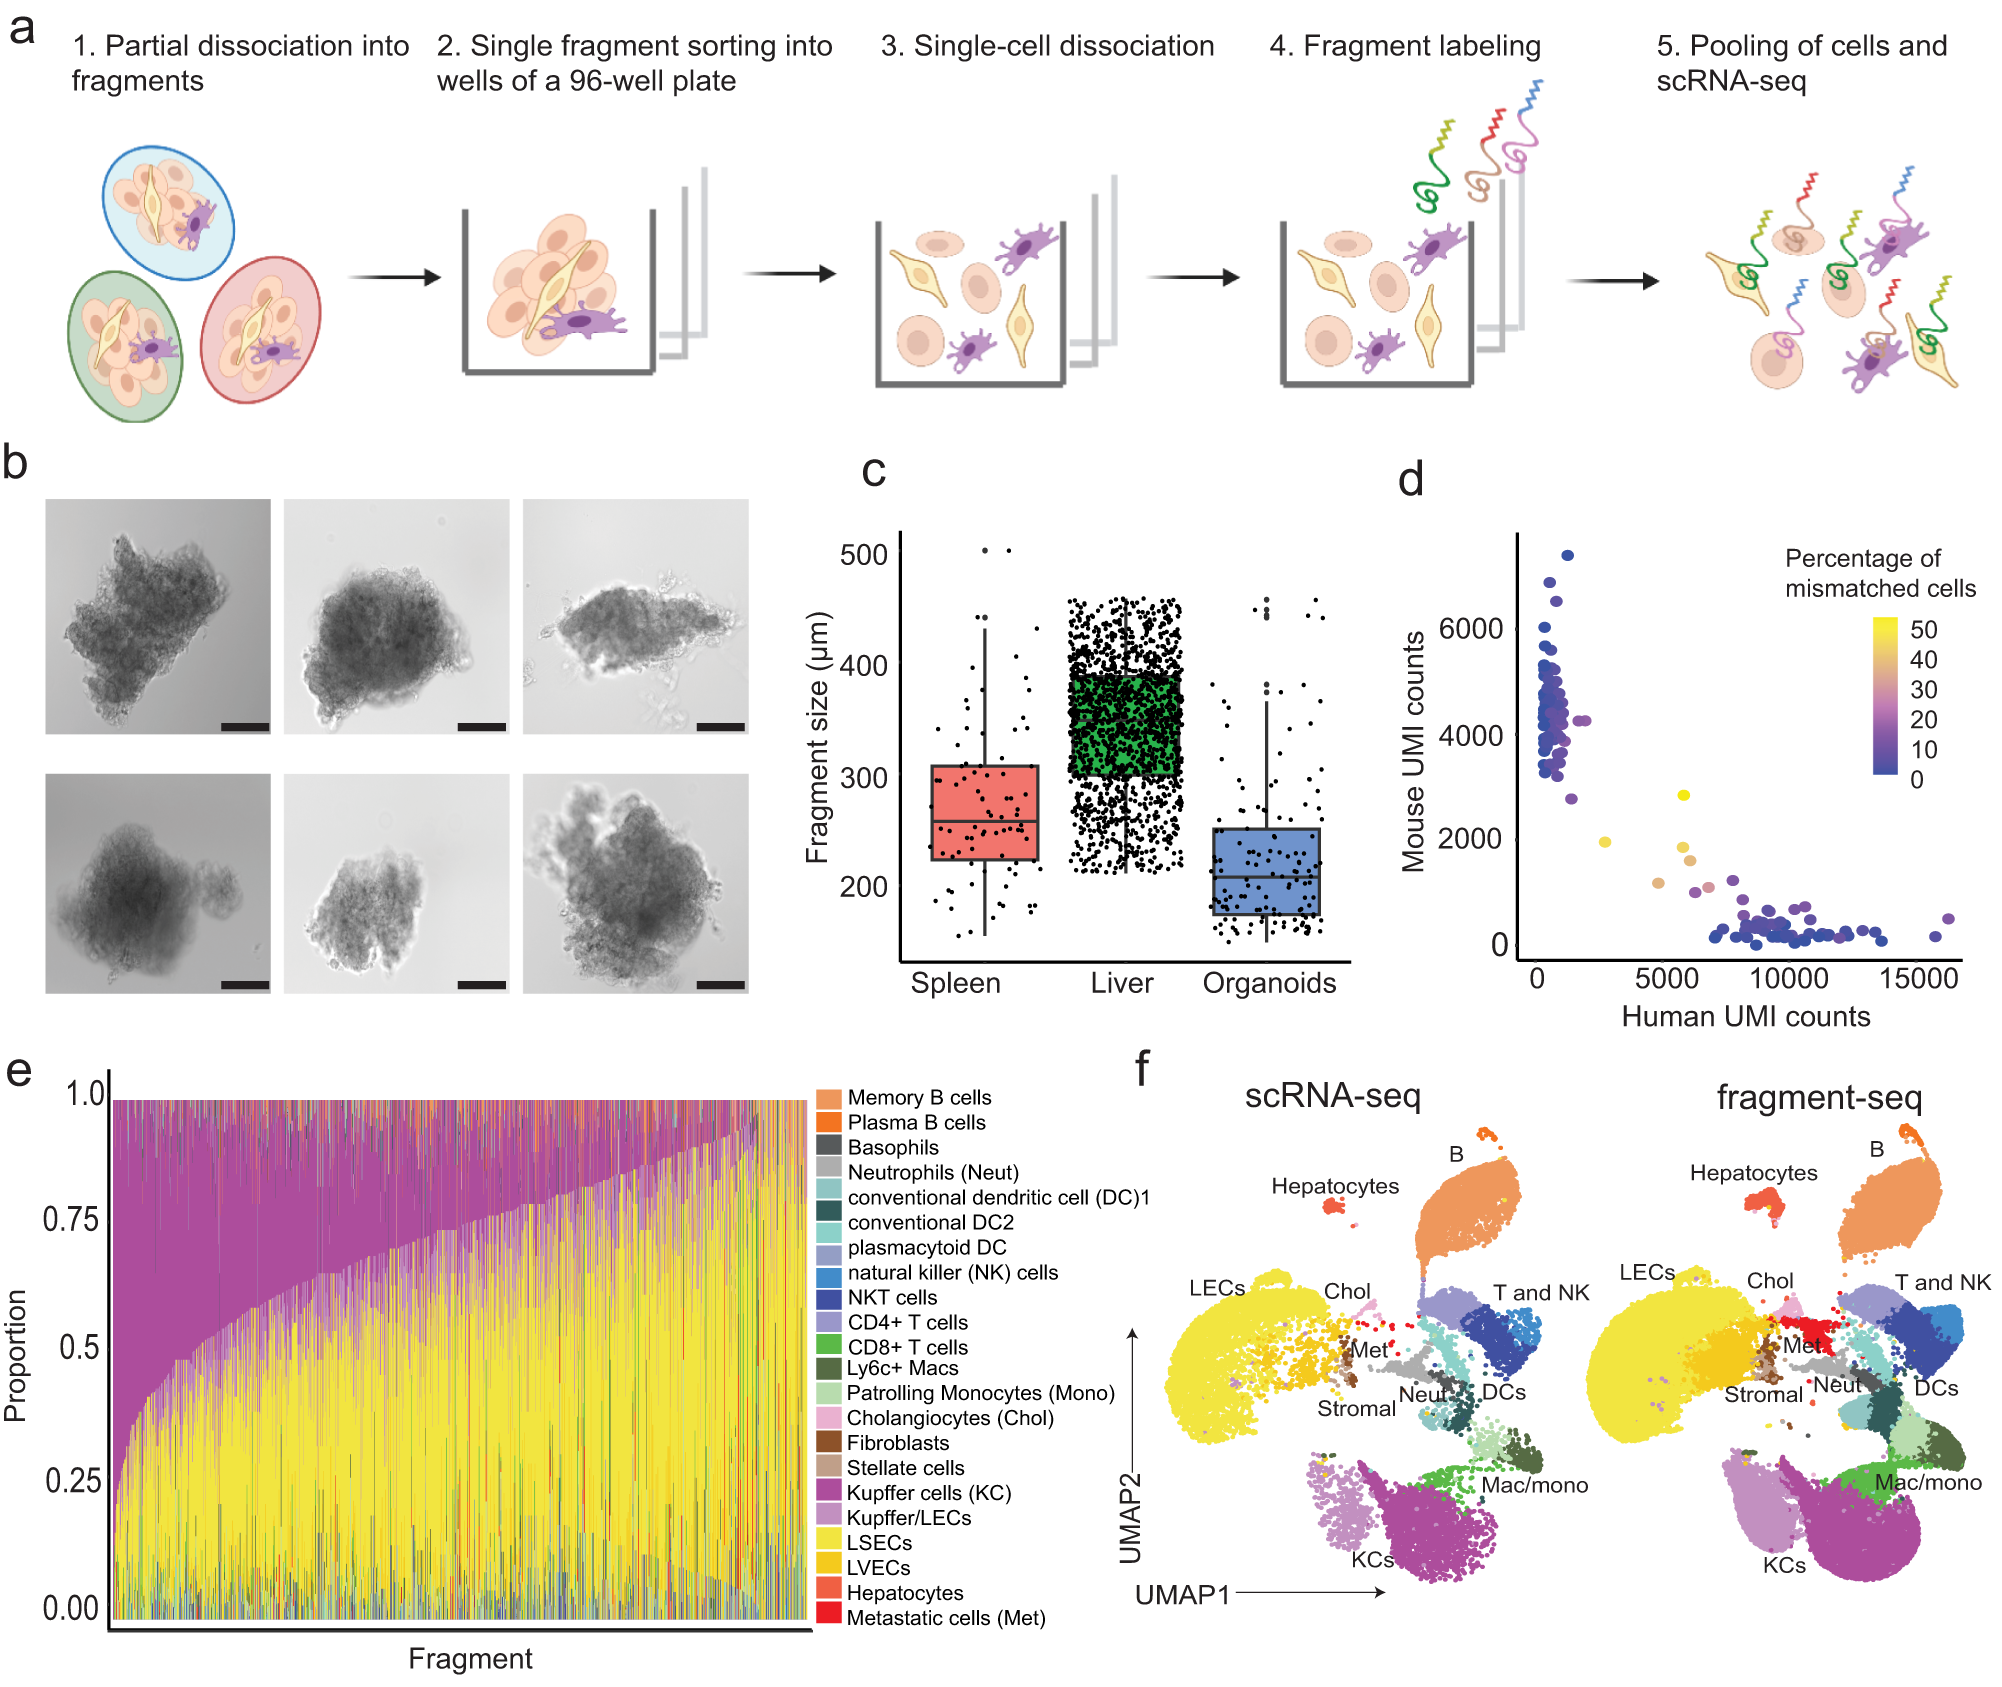
a Schematic illustration of fragment-seq workflow. scRNA-seq: single-cell RNA-sequencing. Created with BioRender.com. b Brightfield microscopy images of representative liver fragments. Scale bar: 100 μm. Imaging was performed for 9 96-well plates in one experiment with results shown in Supplementary Fig. 1b, here six representative fragments are shown. c Fragment-size distribution of sorted fragments from different tissues visualized in boxplots [n = 82 (murine spleen), 1468 (murine liver), 138 (CRC organoid) fragments]. Black dots indicate fragments. For box and whiskers plots the middle line represents the median; the upper and lower lines are the first and third quartile (Q1 and Q3); the whiskers indicate the upper and lower limits of data spread by subtracting 1.5* interquartile range (IQR) from Q1 and adding 1.5* IQR to Q3. d Scatter plot showing the fraction of mismatched cells. Dots represent fragments and their color indicates the percentage of mismatched cells (human cells within mouse fragments and mouse cells within human fragments) (n = 139 fragments from 1 sample). UMI unique molecular identifier. e Barplot showing cell type proportions per fragment; only fragments with at least 5 cells are considered (n = 1568 fragments from a total of 10 samples). LEC liver endothelial cell, LSECs liver sinusoidal endothelial cells, LVECs lymphatic vascular endothelial cells. MAC macrophages f Uniform manifold approximation and projection (UMAP) visualization of batch-corrected (see the “Methods” section), single-cell transcriptomes from fragment-seq and scRNA-seq of mouse metastatic liver samples. Cells are clustered, annotated, and colored by their cell type. Cells are separated based on the protocol [conventional scRNA-seq (n = 2 samples) and fragment-seq (n = 10 samples)]. For c and d the source data are provided as a Source Data file.
Availability – The code generated in this study is available at: https://github.com/Moors-Code/Fragment-sequencing
Handler K, Bach K, Borrelli C, Piscuoglio S, Ficht X, Acar IE, Moor AE. (2023) Fragment-sequencing unveils local tissue microenvironments at single-cell resolution. Nat Commun 14(1):7775. [article]


