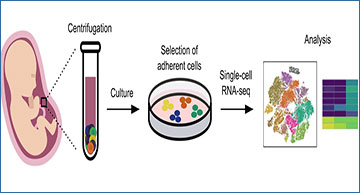
Amniotic fluid has been proposed as an easily available source of cells for numerous applications in regenerative medicine and tissue engineering. The use of amniotic fluid cells in biomedical applications necessitates their unequivocal characterization; however, the exact cellular composition of amniotic fluid and the precise tissue origins of these cells remain largely unclear. Using cells cultured from the human amniotic fluid of fetuses with spina bifida aperta and of a healthy fetus, researchers at the University Children’s Hospital Zurich performed single-cell RNA sequencing to characterize the tissue origin and marker expression of cultured amniotic fluid cells at the single-cell level. Their analysis revealed nine different cell types of stromal, epithelial and immune cell phenotypes, and from various fetal tissue origins, demonstrating the heterogeneity of the cultured amniotic fluid cell population at a single-cell resolution. It also identified cell types of neural origin in amniotic fluid from fetuses with spina bifida aperta. These data provide a comprehensive list of markers for the characterization of the various progenitor and terminally differentiated cell types in cultured amniotic fluid. This study highlights the relevance of single-cell analysis approaches for the characterization of amniotic fluid cells in order to harness their full potential in biomedical research and clinical applications.
Global analysis of single-cell expression profiles in
cultured human AF cells from the second trimester
(A) Overview of the experimental and bioinformatics analysis workflow. Human AF samples of 20–24-week gestational age were cultured and detached at passage 0 for scRNAseq. (B) Unsupervised clustering and t-SNE plot of 45,516 single cells from five human AF cultures (AF from four fetuses with spina bifida aperta (SBA) and one from a healthy fetus). The 13 identified cell clusters are shown in different colors and the labels indicate the assigned cell type. (C) Heatmap with the expression pattern of the top five cluster-specific genes in the 13 clusters. The Z score indicates relative expression. (D) Box plots representing the contribution of the different AF samples (n = 5) to each cell cluster. (E) Pie chart representing the percentage of each cell type detected in the five AF samples.
Dasargyri A, Rodríguez DG, Rehrauer H, Reichmann E, Biedermann T, Moehrlen U. (2023) scRNA-Seq of Cultured Human Amniotic Fluid from Fetuses with Spina Bifida Reveals the Origin and Heterogeneity of the Cellular Content. Cells 12(12). [article]


