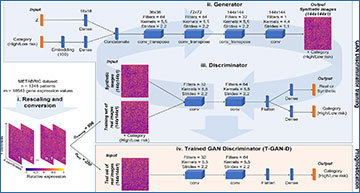
Established prognostic tests based on limited numbers of transcripts can identify high-risk breast cancer patients yet are approved only for individuals presenting with specific clinical features or disease characteristics. Deep learning algorithms could hold potential for stratifying patient cohorts based on full transcriptome data, yet the development of robust classifiers is hampered by the number of variables in omics datasets typically far exceeding the number of patients. To overcome this hurdle, University of Stuttgart researchers have developed a classifier based on a data augmentation pipeline consisting of a Wasserstein generative adversarial network (GAN) with gradient penalty and an embedded auxiliary classifier to obtain a trained GAN discriminator (T-GAN-D). Applied to 1244 patients of the METABRIC breast cancer cohort, this classifier outperformed established breast cancer biomarkers in separating low- from high-risk patients (disease specific death, progression or relapse within 10 years from initial diagnosis). Importantly, the T-GAN-D also performed across independent, merged transcriptome datasets (METABRIC and TCGA-BRCA cohorts), and merging data improved overall patient stratification. In conclusion, the reiterative GAN-based training process allowed generating a robust classifier capable of stratifying low- vs high-risk patients based on full transcriptome data and across independent and heterogeneous breast cancer cohorts.
The T-GAN-D robustly stratifies low and high risk breast cancer patients
(A) Workflow of the data processing, including the schematics of the generator network and its adversary, the discriminator network. Together these result in an AC-WGAN-GP architecture. After the conversion of patient transcriptome profiles into images, 4/5 of the MB dataset was used to train the GAN’s discriminator. After 1000 epochs, the trained discriminator was used as a standalone classifier to separate the remaining 1/5 patients of the dataset into low and high risk categories. (B) Kaplan-Meier curves separating low vs. high risk patients as predicted with the T-GAN-D (iteration 1 of the 5-fold CV shown as representative). (C) Kaplan-Meier curves generated pooling the category predictions obtained for all patients of the MB dataset after five independent CV runs. (D) Separation of low vs. high risk patients predicted with a classical CNN on the same subset used in B and (E) comparison obtained pooling the predictions of five independent CV runs. The area between the curves (ABC) between Low risk (blue dashed line) and Predicted low risk (solid blue line), Predicted low risk and Predicted high risk (solid red line), Predicted high risk and High risk groups (dashed red line) are shown top to bottom in D and E.
Guttà C, Morhard C, Rehm M (2023) Applying a GAN-based classifier to improve transcriptome-based prognostication in breast cancer. PLoS Comput Biol 19(4): e1011035. [article]


