Single-cell multi-omics can provide a unique perspective on tumor cellular heterogeneity. Most previous single-cell whole-genome RNA sequencing (scWGS-RNA-seq) methods demonstrate utility with intact cells from fresh samples. Among them, many are not applicable to frozen samples that cannot produce intact single-cell suspensions. Researchers at the Hong Kong University of Science and Technology have developed scONE-seq, a versatile scWGS-RNA-seq method that amplifies single-cell DNA and RNA without separating them from each other and hence is compatible with frozen biobanked samples. The researchers benchmarked scONE-seq against existing methods using fresh and frozen samples to demonstrate its performance in various aspects. They identified a unique transcriptionally normal-like tumor clone by analyzing a 2-year frozen astrocytoma sample, demonstrating that performing single-cell multi-omics interrogation on biobanked tissue by scONE-seq could enable previously unidentified discoveries in tumor biology.
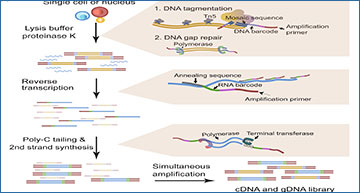
Overview of scONE-seq library preparation and benchmarking results
(A) The molecular mechanism of scONE-seq workflow. (B) Box plot shows gene detection numbers in scONE-seq whole-cell dataset, scONE-seq nucleus dataset, and SS2 dataset (HCT116, n = 90, 93, and 94, respectively). All samples were downsampled to 40,000 mapped reads to match with the nuclei dataset (P < 2 × 10-16, t test between scONE-seq cells and SS2). (C) Gene body coverage for scONE-seq cells, nuclei, and Smart-seq2 (n = 90, 93, and 94, respectively). Error areas are indicated by ± SD between cells. (D) Accuracy across mock samples (150,000 mapped reads). Pearson correlations were calculated from log-transformed TPM (transcript per million). (E) Lorenz curve of bulk and scONE-seq data (cells, 88; nuclei, 83). Percentiles of the genome covered are plotted against the cumulative fraction of reads. A perfect coverage uniformity results in a straight line with the slope as 1. Error areas are indicated by ±SD between cells. (F) Dot plots with normalized counts across the genome superimposed with solid line plots to visualize integer copy numbers. Amplification regions are in red; deletion regions are in light blue. Data from bulk HCT116 WGS (top; bin size = 25 kb and depth = 30×), HCT116 scONE-seq pseudo-bulk data (middle; bin-size = 500 kb and n = 88), and a representative single-cell HCT116 scONE-seq data (bottom; window size = 500 kb, n = 1, and depth = 0.056×) are shown. (G) The bar plot shows the fraction of mapped regions from different assays (n = 93, 90, 1, 94, 1, and 1, respectively). scONE-seq RNA control refers to RNA-only assays. scONE-seq DNA refers to DNA-only assays.
Yu L, Wang X, Mu Q, Tam SST, Loi DSC, Chan AKY, Poon WS, Ng HK, Chan DTM, Wang J, Wu AR. (2023) scONE-seq: A single-cell multi-omics method enables simultaneous dissection of phenotype and genotype heterogeneity from frozen tumors. Sci Adv 9(1):eabp8901. [article]


