

Depression and anxiety are major global health burdens. Although SSRIs targeting the serotonergic system are prescribed over 200 million times annually, they have variable therapeutic efficacy and side effects, and mechanisms of action remain incompletely understood. Researchers at A*STAR, Singapore comprehensively characterized the molecular landscape of gene regulatory changes associated with fluoxetine, a widely-used SSRI. They performed multimodal analysis of SSRI response in 27 mammalian brain regions using 310 bulk RNA-seq and H3K27ac ChIP-seq datasets, followed by in-depth characterisation of two hippocampal regions using single-cell RNA-seq (20 datasets).
Remarkably, fluoxetine induced profound region-specific shifts in gene expression and chromatin state, including in the nucleus accumbens shell, locus coeruleus and septal areas, as well as in more well-studied regions such as the raphe and hippocampal dentate gyrus. Expression changes were strongly enriched at GWAS loci for depression and antidepressant drug response, stressing the relevance to human phenotypes. The researchers observed differential expression at dozens of signalling receptors and pathways, many of which are previously unknown. Single-cell analysis revealed stark differences in fluoxetine response between the dorsal and ventral hippocampal dentate gyri, particularly in oligodendrocytes, mossy cells and inhibitory neurons. Across diverse brain regions, integrative omics analysis consistently suggested increased energy metabolism via oxidative phosphorylation and mitochondrial changes, which they corroborated in vitro; this may thus constitute a shared mechanism of action of fluoxetine. Similarly, the researchers observed pervasive chromatin remodelling signatures across the brain.
Genome-wide transcriptome changes by fluoxetine (Prozac)
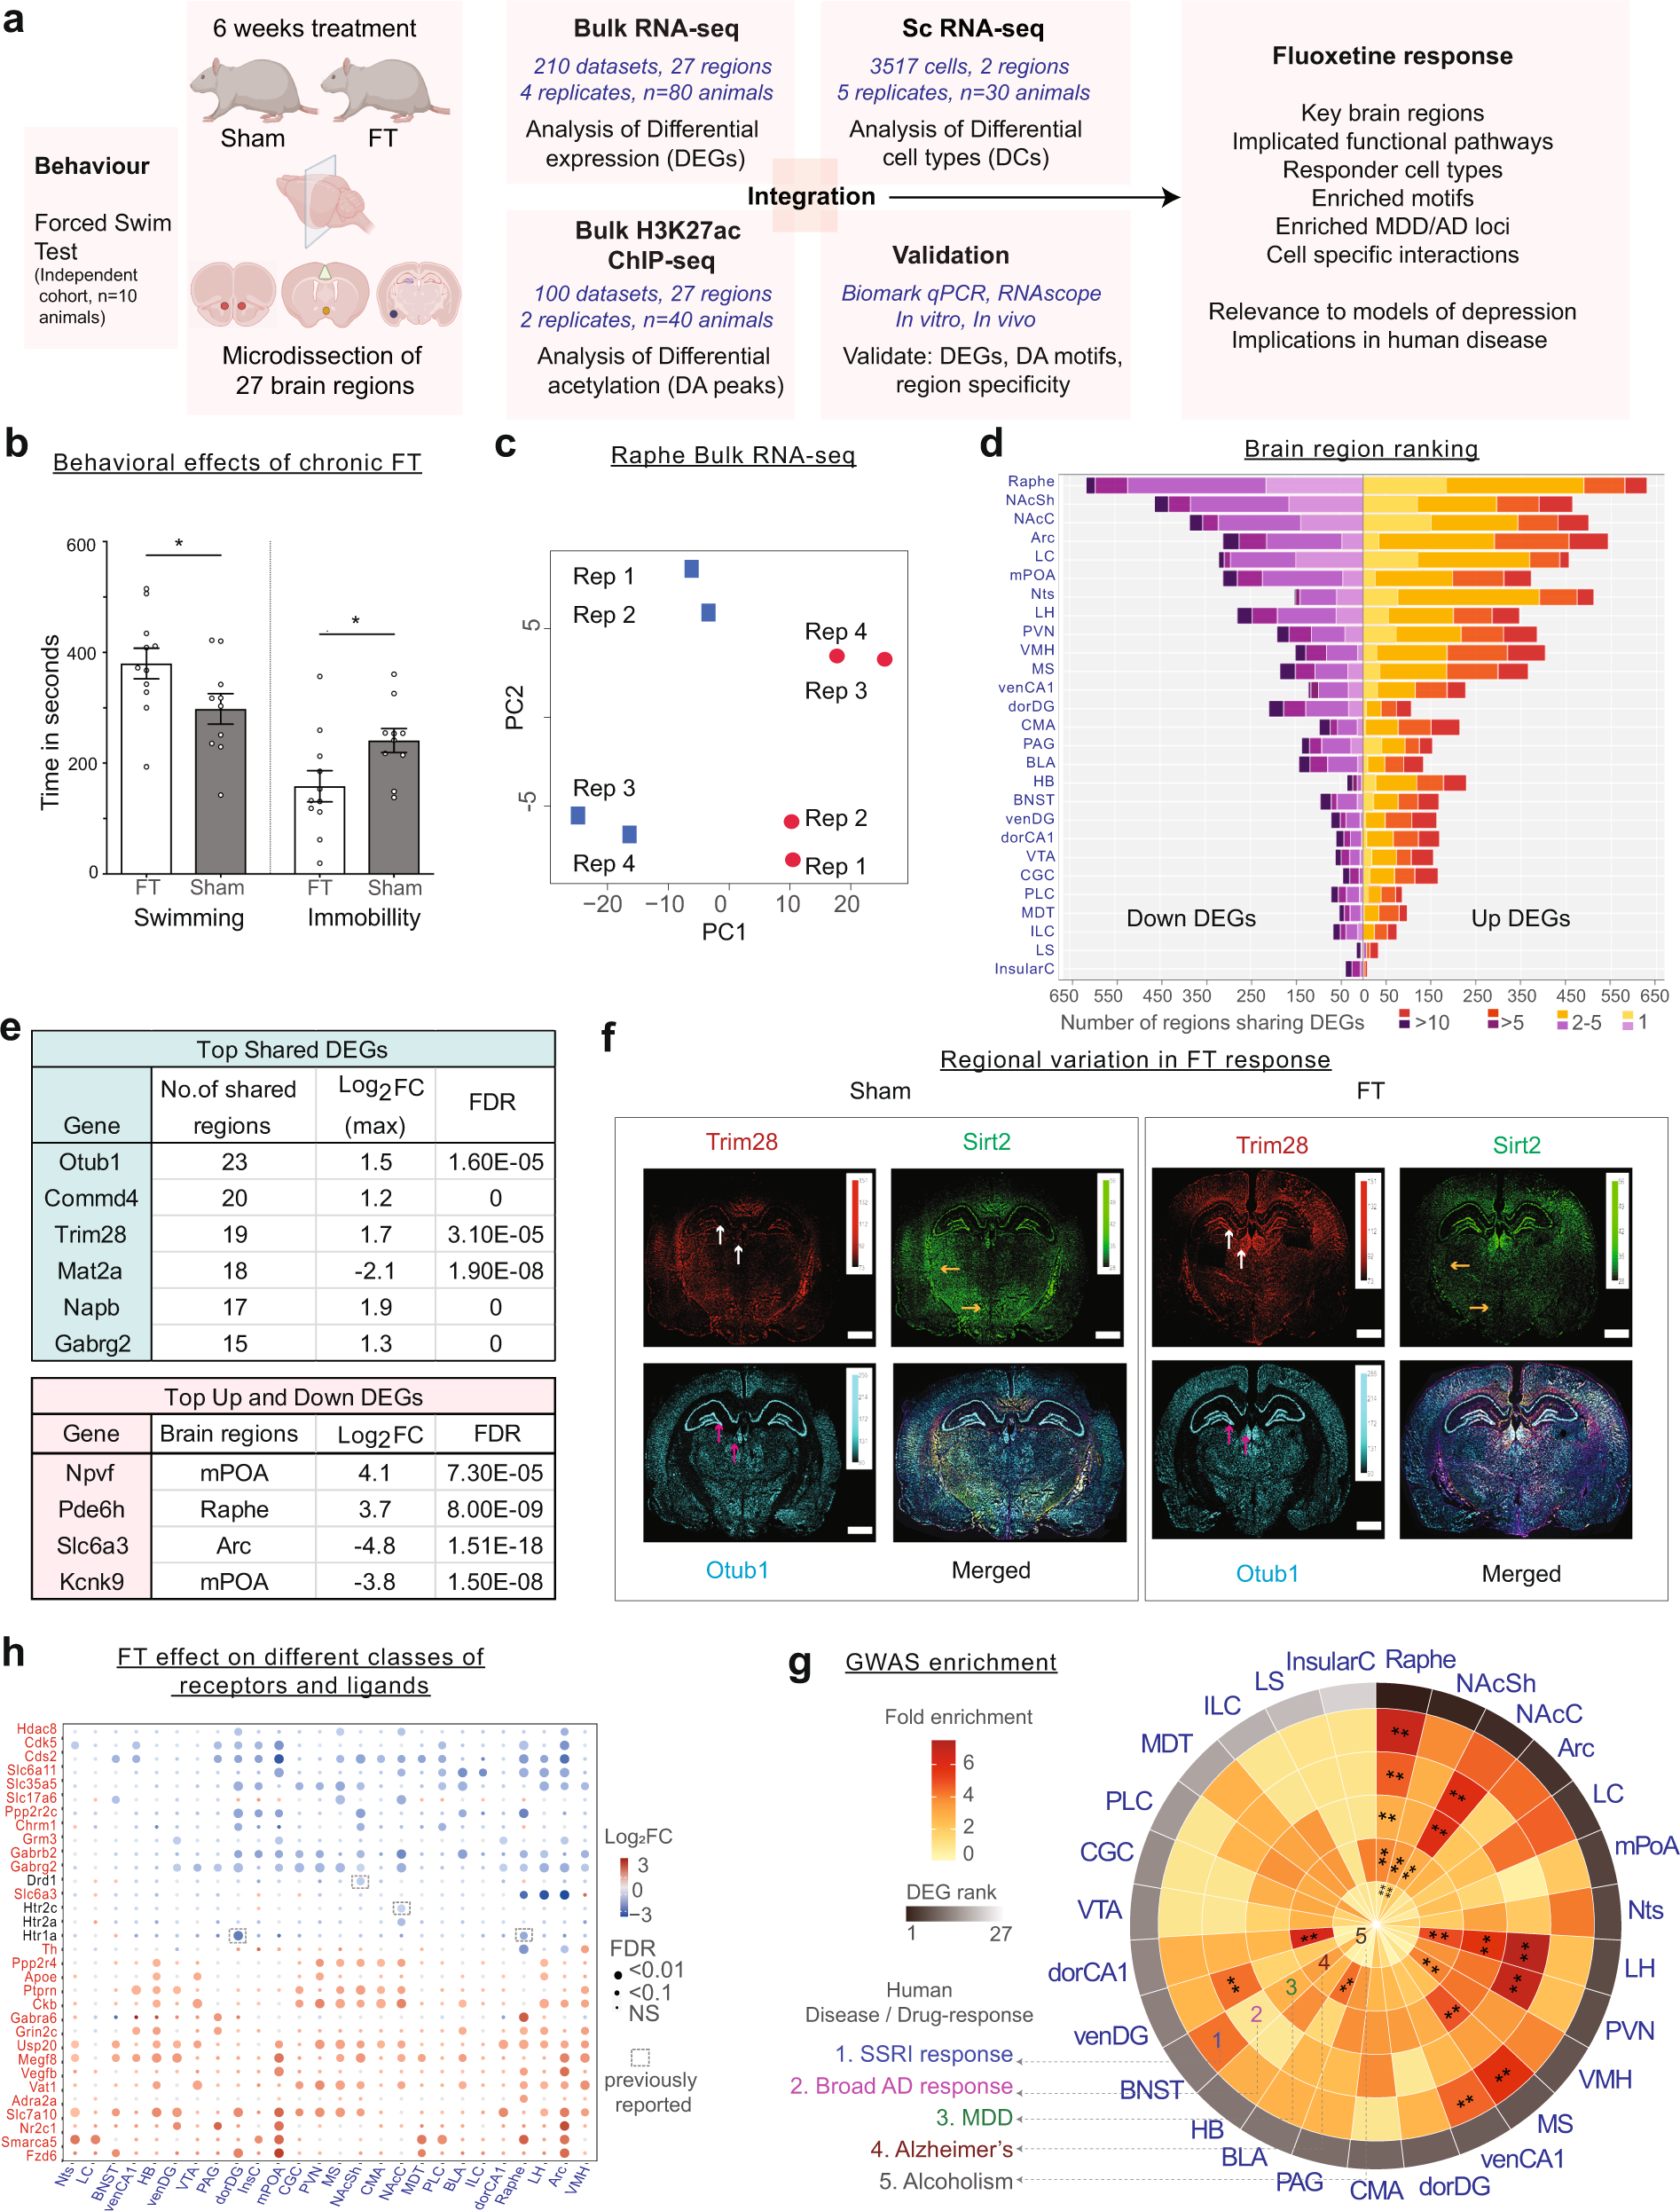
a Schematic overview of data generation and workflow. b Forced swim test following chronic fluoxetine treatment in adult rats. Time spent swimming, being immobile are shown for sham and fluoxetine treated groups. * indicates P-val < 0.05. c RNA-seq dataset QC: Principal Component Analysis (PCA) visualisation of eight samples of the raphe region. Sham replicates are coloured in blue and FT coloured in red. d Statistics of RNA-seq dataset: Number of upregulated and downregulated DEGs across 27 brain regions (and number in each category shared between regions). e Top: table showing DEGs shared in ≥15 regions, along with the maximum log2FC and its corresponding FDR. Bottom: table showing strongest upregulated and downregulated region-specific DEGs. f Regional variation in fluoxetine DEGs as measured by RNAscope. For each gene, arrows denote regions with significant differential expression between FT and Sham that are consistent with bulk RNA-seq results. g Circular heat map showing the fold-enrichment of identified region-wise DEGs in GWAS loci for five phenotypes. * indicates FDR Q-val ≤ 0.05; ** FDR Q-val ≤ 0.01. h Differential expression status of key neurotransmission genes identified. Grey boxes denote previous findings reported in the literature.
This study reveals unexpected regional and cell type-specific heterogeneity in SSRI action, highlights under-studied brain regions that may play a major role in antidepressant response, and provides a rich resource of candidate cell types, genes, gene regulatory elements and pathways for mechanistic analysis and identifying new therapeutic targets for depression and anxiety.
Rayan NA, Kumar V, Aow J, Rastegar N, Lim MGL, O’Toole N, Aliwarga E, Arcego DM, Yeo HTG, Wong JY, Lee MY, Schmidt F, Haja HS, Tam WL, Zhang TY, Diorio J, Anacker C, Hen R, Parent C, Meaney MJ, Prabhakar S. (2022) Integrative multi-omics landscape of fluoxetine action across 27 brain regions reveals global increase in energy metabolism and region-specific chromatin remodelling. Mol Psychiatry [Epub ahead of print]. [article].


