New process reveals single-cell secrets for novel therapeutic targets
University of California, Irvine neuroscientists probing the gene changes behind Alzheimer’s disease have developed a process of making a “meta-cell” that overcomes the challenges of studying a single cell. Their technique has already revealed important new information and can be used to study other diseases throughout the body.
Details about the meta-cell – created by researchers with the UCI Institute for Memory Impairments and Neurological Disorders, known as UCI MIND – were published in the online journal Cell Press.
Technologies called transcriptomics that study sets of RNA within organisms enable scientists to understand what each cell does. However, the question of how particular genes work within a solo cell, a process known as single-cell genomics, has not been widely studied. As a result, it has still been difficult to determine which genes are associated with disease or carrying out normal functions.
“The challenge is that a single cell does not contain much RNA,” said first author Samuel Morabito, a UCI graduate student researcher in the mathematical, computational and systems biology program. “This sparsity makes it hard to study. Even if a gene is present, technology might miss it.”
However, single-cell genomics is a powerful tool in the search for disease prevention and cures.
“If we know that a gene process is degrading cells, we can potentially intervene,” said lead author Vivek Swarup, UCI assistant professor of neurobiology and behavior. “We can devise therapeutics and target hundreds of genes to stop disease from developing.”
The team has now devised a way to eliminate this obstacle.
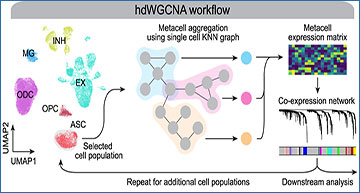
“In working with an individual cell, we looked for others that are the most similar in terms of transcriptomics,” Swarup said. “By taking an average of 50 such cells, we developed a meta-cell that represents an individual cell but without the scarcity problems.”
The new process, named hdWGCNA, improves on a method called RNA bulk sequencing that’s widely used but does not address single-cell genomes. The researchers utilized their laboratory’s own data and information from two other published studies to devise the process. They examined microglia, the brain’s primary immune cells, which carry most of the common Alzheimer’s genetic risk factors. Their findings revealed important insights and key areas to investigate further.
Overview of the hdWGCNA workflow and application in the human prefrontal cortex
(A) Schematic overview of the standard hdWGCNA workflow on a scRNA-seq dataset. UMAP plot shows 36,671 cells from 11 cognitively normal donors in the Zhou et al. human prefrontal cortex (PFC) dataset. ASC, astrocytes; EX, excitatory neurons; INH, inhibitory neurons; MG, microglia; ODC, oligodendrocytes; OPC, oligodendrocyte progenitor cells. (B) Density plot showing the distribution of pairwise Pearson correlations between genes from the single-cell (sc) expression matrix and metacell expression matrices with varying values of the K-nearest neighbors parameter K. (C) Expression matrix density (1, sparsity) for the sc, pseudo-bulk (pb), and metacell matrices with varying values of K in each cell type. (D) Heatmap of scaled gene expression for the top five hub genes by kME in INH-M6, EX-M2, ODC-M3, OPC-M2, ASC-M18, and MG-M14. (E) snRNA-seq UMAP colored by module eigengene (ME) for selected modules as in (D). (F) UMAP plot of the ODC co-expression network. Each node represents a single gene, and edges represent co-expression links between genes and module hub genes. Point size is scaled by kME. Nodes are colored by co-expression module assignment. The top two hub genes per module are labeled. Network edges were downsampled for visual clarity. (G) snRNA-seq UMAP as in (A) colored by MEs for the 10 ODC co-expression modules as in (F). (H) Module preservation analysis of the ODC modules in the Morabito et al.12 human PFC dataset. The module’s size versus the preservation statistic (Z preservation) is shown for each module. Z > 5, not preserved; 10 > Z > 5, moderately preserved; Z > 10 , highly preserved.
“We found it’s not easy to distinguish between good microglia that are doing their normal job and bad microglia that damage neurons,” Swarup said. “Normal brains have good microglia, but a large proportion of microglia in people with Alzheimer’s is altered to be reactive microglia. Also, the bad kind specific to Alzheimer’s has different types, and we discovered microglia states that were not previously known.” The team plans to next look at how genes regulate microglia and whether gene activity can be moderated or stopped through therapeutics.
While the researchers are focusing on neurological disorders, hdWGCNA is a versatile computational approach that can identify patterns of gene expression and gene modules associated with specific diseases, regardless of the organ or tissue involved.
Source – UC Irvine
Availability – hdWGCNA R package: https://zenodo.org/record/6835227
Morabito S, Reese F, Rahimzadeh N, Miyoshi E, Swarup V. (2023) hdWGCNA identifies co-expression networks in high-dimensional transcriptomics data. Cell Rep Meth [Epub ahead of print]. [article]


