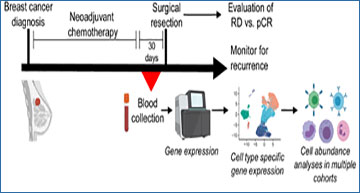
Neoadjuvant chemotherapy (NAC) is the standard of care for many patients with breast cancer. Biomarkers of response are needed to identify appropriate therapies and avoid unnecessary toxicity.
In a retrospective study of four cohorts of NAC-treated patients with breast cancer, Margaret Axelrod, PhD, and her advisor, Justin Balko, PharmD, PhD, and colleagues used single-cell RNA sequencing to identify an immunologic gene signature preferentially expressed by peripheral monocytes (white blood cells) that was higher in patients with a complete response.
Peripheral monocytes measured clinically also were higher in patients with good outcomes.
This study, published in Cancer Research Communications, found that peripheral (minimally invasive) biomarkers may be helpful in predicting long-term outcomes in patients undergoing NAC. These results also suggest that patients with higher levels of monocytes reflect robust blood cell regeneration after chemotherapy, leading to better outcomes following treatment.
Expression of immune-related genes in the peripheral blood
is associated with good outcome following NAC
A, Schematic describing blood collection timing and downstream analyses. B, GSEA plots for gene sets enriched in blood of patients with pCR relative to RD. C, Expression of IFN/complement and cytotoxicity scores is shown for each sample. D, Cytotoxic, IFN/complement, and combined PIRSs (IFN/complement score minus cytotoxic score) are shown for each sample, stratified by outcome. Box plots show the median, first and third quartiles. P values represent FDR-corrected Wilcoxon tests. E, Single-cell sequencing of PBMCs shows cell type specific expression of each score. Cytotoxic score is shown in red. IFN/complement score is shown in blue. Coexpression would be shown in pink.
Further studies are needed to test this hypothesis, as well as to explore the utility of using peripheral blood biomarkers to predict response to immunotherapy.
Source – Vanderbilt University Medical Center
Axelrod ML, Wang Y, Xu Y et al. (2022) Peripheral Blood Monocyte Abundance Predicts Outcomes in Patients with Breast Cancer. Cancer Res Comm 2(5): 286–292. [article]


