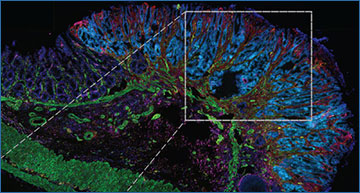
The tumor microenvironment, which includes epithelial, immune and connective tissue cells, plays important roles in the pathogenesis of colorectal tumors.
Few studies have examined how the microenvironment changes as colorectal tumors transition from advanced adenomas to pre-invasive carcinomas. Ken Lau, PhD, and colleagues have now used single-cell RNA-sequencing, multiplex immunofluorescence imaging, and computational approaches to explore the colonic tumor microenvironment in mouse models of advanced adenoma (APC) and pre-invasive inflammation-induced cancer (AOM/DSS).
The researchers found that colonic tumors in the APC and AOM/DSS models have distinct microenvironments. The AOM/DSS model microenvironment contains more diverse and abundant cancer-associated fibroblasts that spatially associate with neoplastic cells. Lau and colleagues also identified a unique squamous cell population, which increased following the cessation of chemotherapy, in the AOM/DSS model but not in the APC model.
Cell type composition of wildtype, APC tumor, APC adjacent normal,
and AOM/DSS tumor samples assessed by scRNA-seq
(A) Experimental timeline for induction of APC tumors (top) and AOM/DSS tumors (bottom). (B) Representative H&E images of APC tumors and AOM/DSS tumors. Scale bars = 300 µm. UMAP co-embedding of wildtype, APC tumor, APC adjacent normal, and AOM/DSS tumor scRNA-seq samples with (C) cell type clustering overlay, (D) sample type overlay, and (E) replicate overlay, by color. (F) Bar graph of cell type proportions, broken down by sample type in scRNA-seq data. (G) sc-Unifrac analysis of APC tumor sample cell types compared to AOM/DSS tumor sample cell types from scRNA-seq data. Colored branches indicate statistically enriched cell population structures per sample type, with black branches indicating non-significance. Pie charts indicate the proportional representation between the two sample types. Thickness of branches represent level of enrichment sc-Unifrac distance values range from 0 to 1, with 0 representing complete overlap between two datasets sc-Unifrac distance = 0.35.
The findings provide important insight into microenvironment components and their interactions in models that differ in the stage of colorectal tumor progression.
Source – VUMC Reporter
Vega PN, Nilsson A, Kumar MP, Niitsu H, Simmons AJ, Ro J, Wang J, Chen Z, Joughin BA, Li W, McKinley ET, Liu Q, Roland JT, Washington MK, Coffey RJ, Lauffenburger DA, Lau KS. (2022) Cancer-Associated Fibroblasts and Squamous Epithelial Cells Constitute a Unique Microenvironment in a Mouse Model of Inflammation-Induced Colon Cancer. Front Oncol 12:878920. [article]


