

Novel methods that combine single cell RNA-seq with CRISPR screens enable high-throughput characterization of transcriptional changes caused by genetic perturbations. Dedicated software is however lacking to annotate CRISPR guide RNA (gRNA) libraries and associate them with single cell transcriptomes. Here, researchers from KU Leuven describe a CRISPR droplet sequencing (CROP-seq) dataset. During analysis, the researchers observed that the most commonly used method fails to detect mutant gRNAs. They therefore developed a python tool to identify and characterize intact and mutant gRNAs, called GiRAFR. The researchers show that mutant gRNAs are dysfunctional, and failure to detect and annotate them leads to an inflated estimate of the number of untransformed cells, attenuated downregulation of target genes, as well as an underestimated multiplet frequency. These findings are mirrored in publicly available datasets, where they found that up to 35% of cells are transduced with a mutant gRNA. Applying GiRAFR hence stands to improve the annotation and quality of single cell CRISPR screens.
Development of GiRAFR and its application to an in-house CROP-seq data
with comparison of results from Cell Ranger feature barcoding analysis
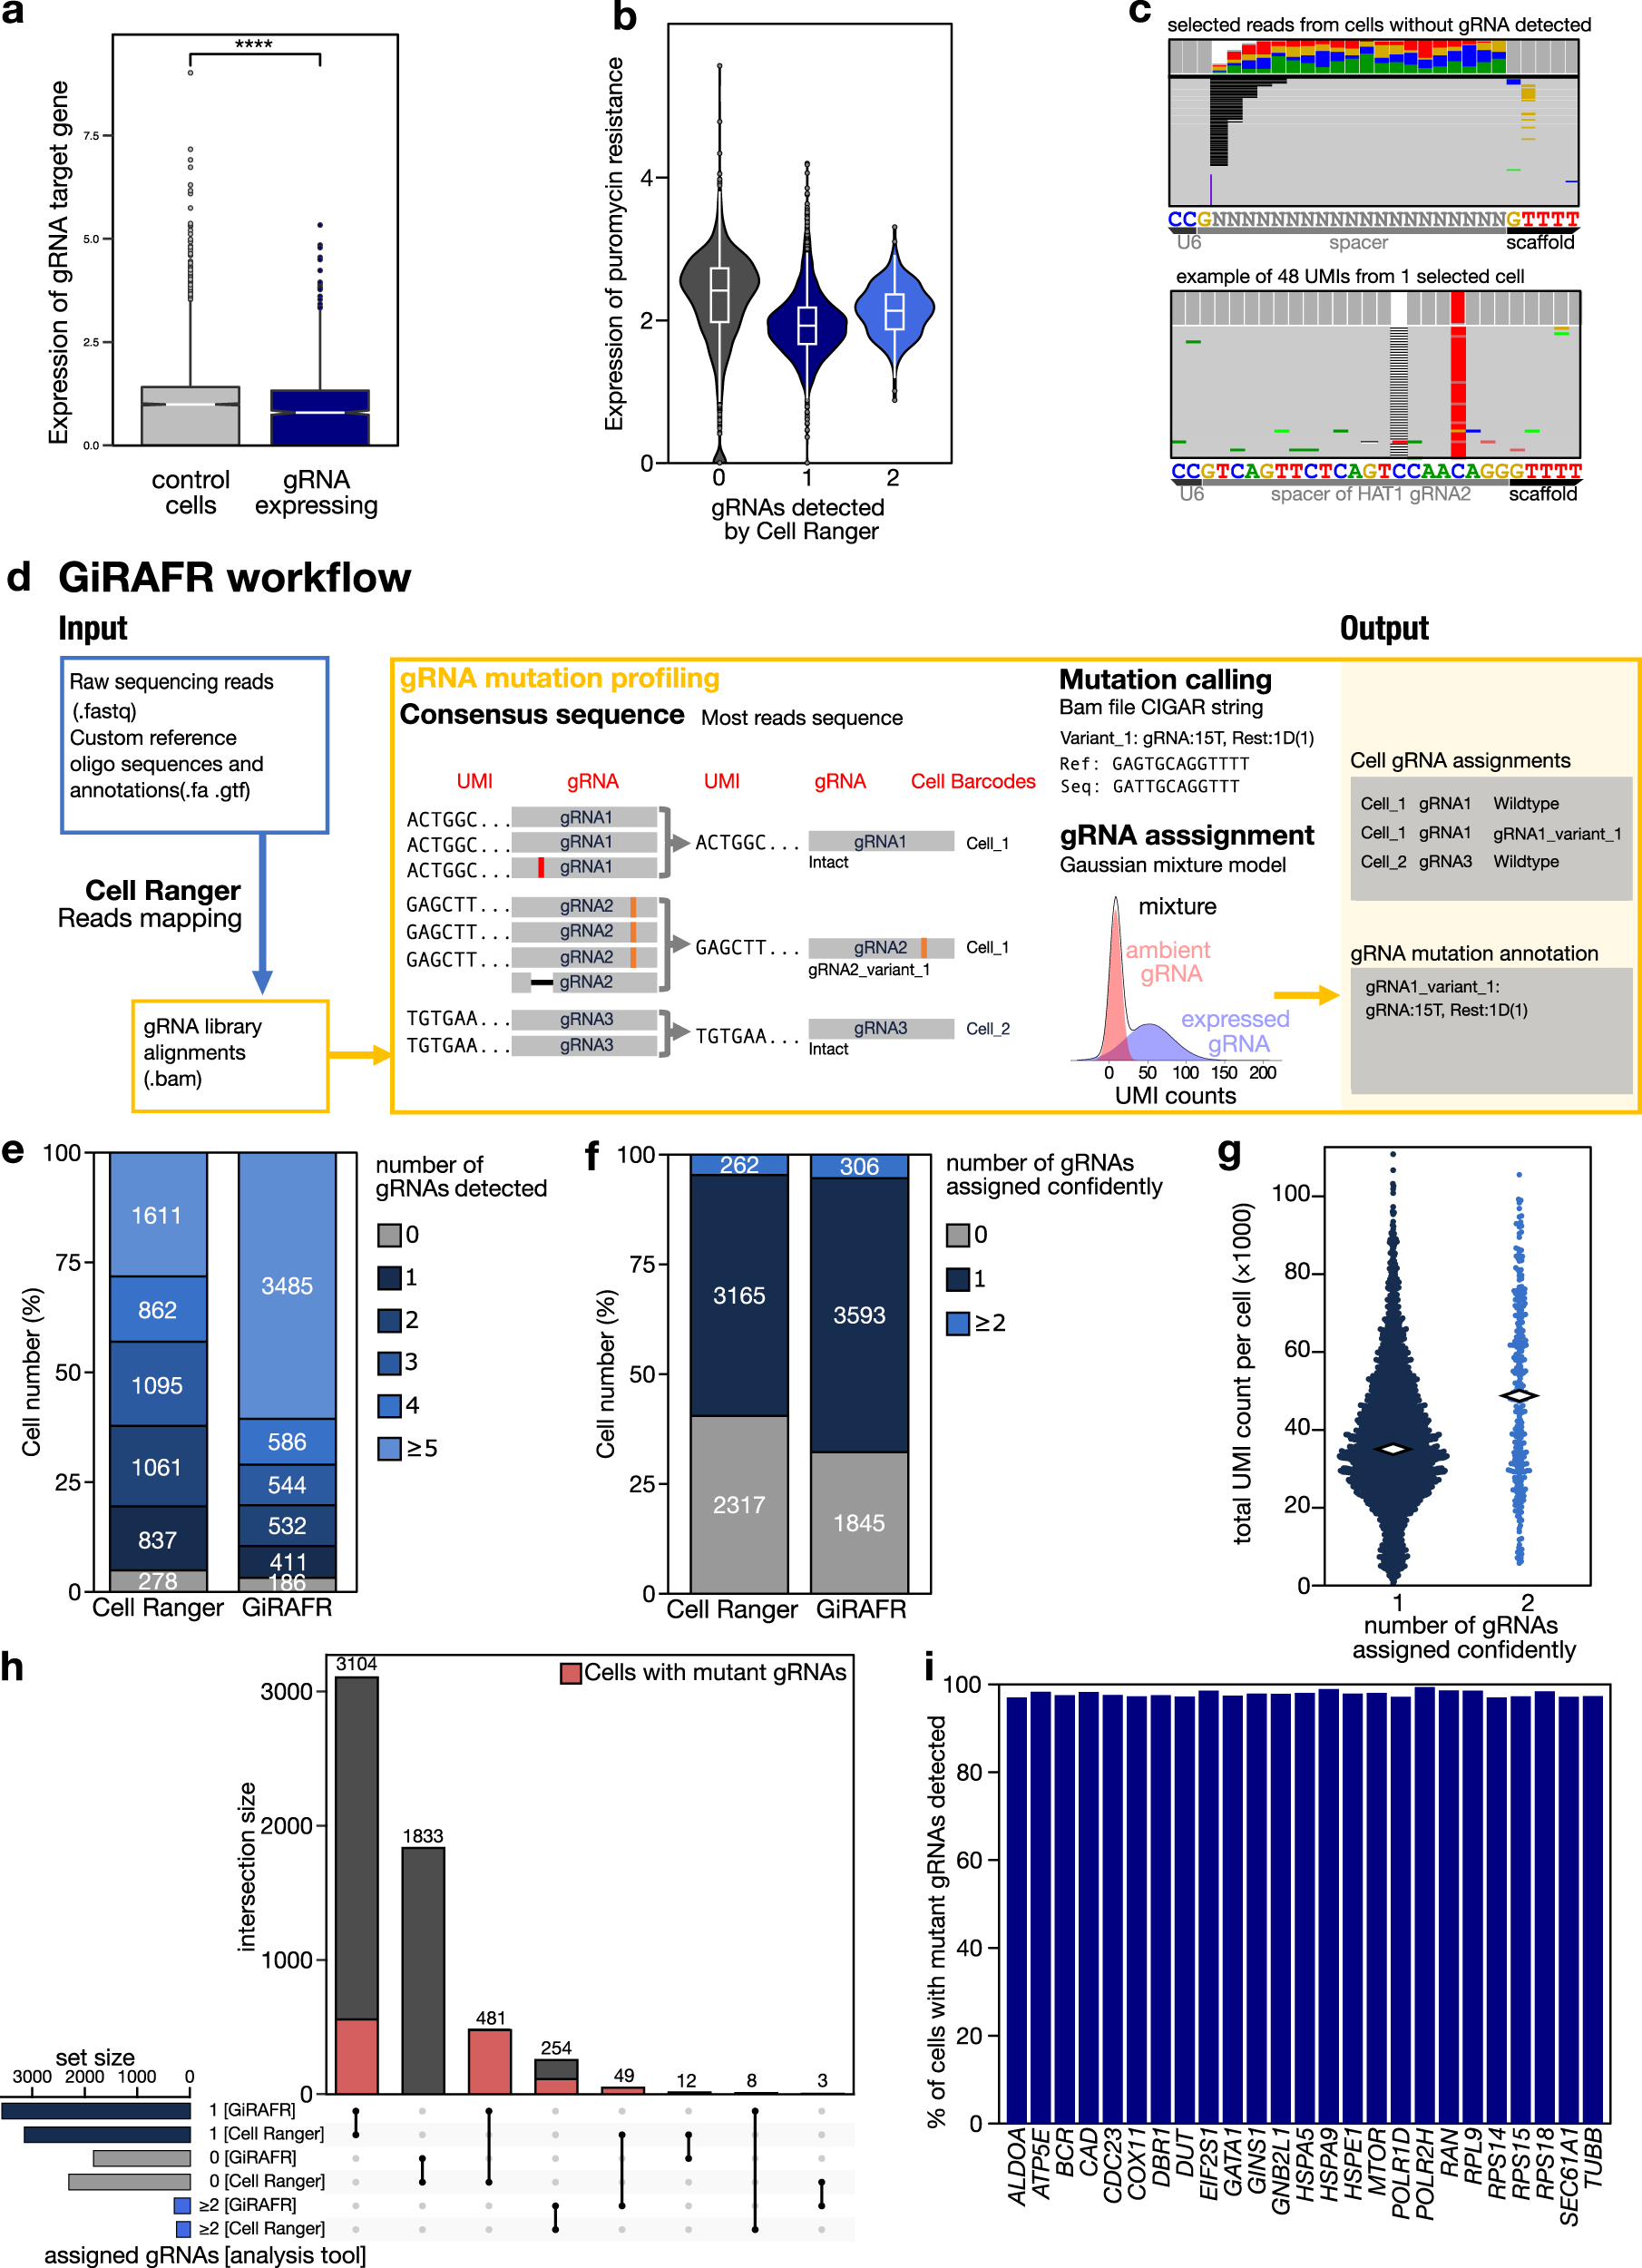
a Expression (log-transformed read counts) of gRNA target genes, normalized to their expression in cells with non-targeting gRNAs (control cells). Shown is the aggregate expression of the 14 target genes which show expression in at least 50% of all control cells. ****:P < 0.0001 by two-sided t test. Box plot denotes quartile range (box), median (center line), and 1.5× interquartile range (whiskers). b Expression of the Puromycin resistance cassette, after mapping the scRNA-seq library to a reference augmented to include the Puromycin resistance cassette. Shown is the log-normalized expression in cells where 0, 1, or 2 gRNAs were detected by Cell Ranger feature barcoding analysis. Box plots inside violin plots denote quartile ranges (box), median (center mark), and 1.5× interquartile range (whiskers). c Reads with unique UMIs showing partial mapping to the 20 bp spacer region, using either Ns as a reference (left), or from 1 cell expressing a variant HAT1 gRNA using this gRNA as a reference. d Schematic workflow of the GiRAFR pipeline. See methods for additional details. e, f Number of cells with gRNA spacer assigned by Cell Ranger and GiRAFR (e) in the raw count matrix and (f) after application of the Gaussian Mixture model represented in panel d. g Beeswarm plot showing the number of UMIs per cell in cells with single gRNA and 2 gRNAs from GiRAFR. Median numbers are indicated on plot. h Comparison of gRNA assignment to cells between Cell Ranger and GiRAFR. The red box indicates cells containing 1 or more mutant gRNAs. i Detection rate of mutant gRNAs by GiRAFR in a Perturb-seq dataset, containing 103 predesigned mutant gRNAs.
Availability – GiRAFR is available as an open-source Python package at our GitHub Repository (github.com/FunctionalEpigeneticsLab/GiRAFR) and Zenodo repository with https://doi.org/10.5281/zenodo.8333711
Yu Q, Van Minsel P, Galle E, Thienpont B. (2023) GiRAFR improves gRNA detection and annotation in single-cell CRISPR screens. Commun Biol 6(1):975. [article]


