

Transcriptional heterogeneity among malignant cells of a tumor has been studied in individual cancer types and shown to be organized into cancer cell states; however, it remains unclear to what extent these states span tumor types, constituting general features of cancer. Researchers at NYU Langone Health have performed a pan-cancer single-cell RNA-sequencing analysis across 15 cancer types and identified a catalog of gene modules whose expression defines recurrent cancer cell states including ‘stress’, ‘interferon response’, ‘epithelial-mesenchymal transition’, ‘metal response’, ‘basal’ and ‘ciliated’. Spatial transcriptomic analysis linked the interferon response in cancer cells to T cells and macrophages in the tumor microenvironment. Using mouse models, the researchers further found that induction of the interferon response module varies by tumor location and is diminished upon elimination of lymphocytes. This work provides a framework for studying how cancer cell states interact with the tumor microenvironment to form organized systems capable of immune evasion, drug resistance and metastasis.
Catalog of recurrent cancer gene modules
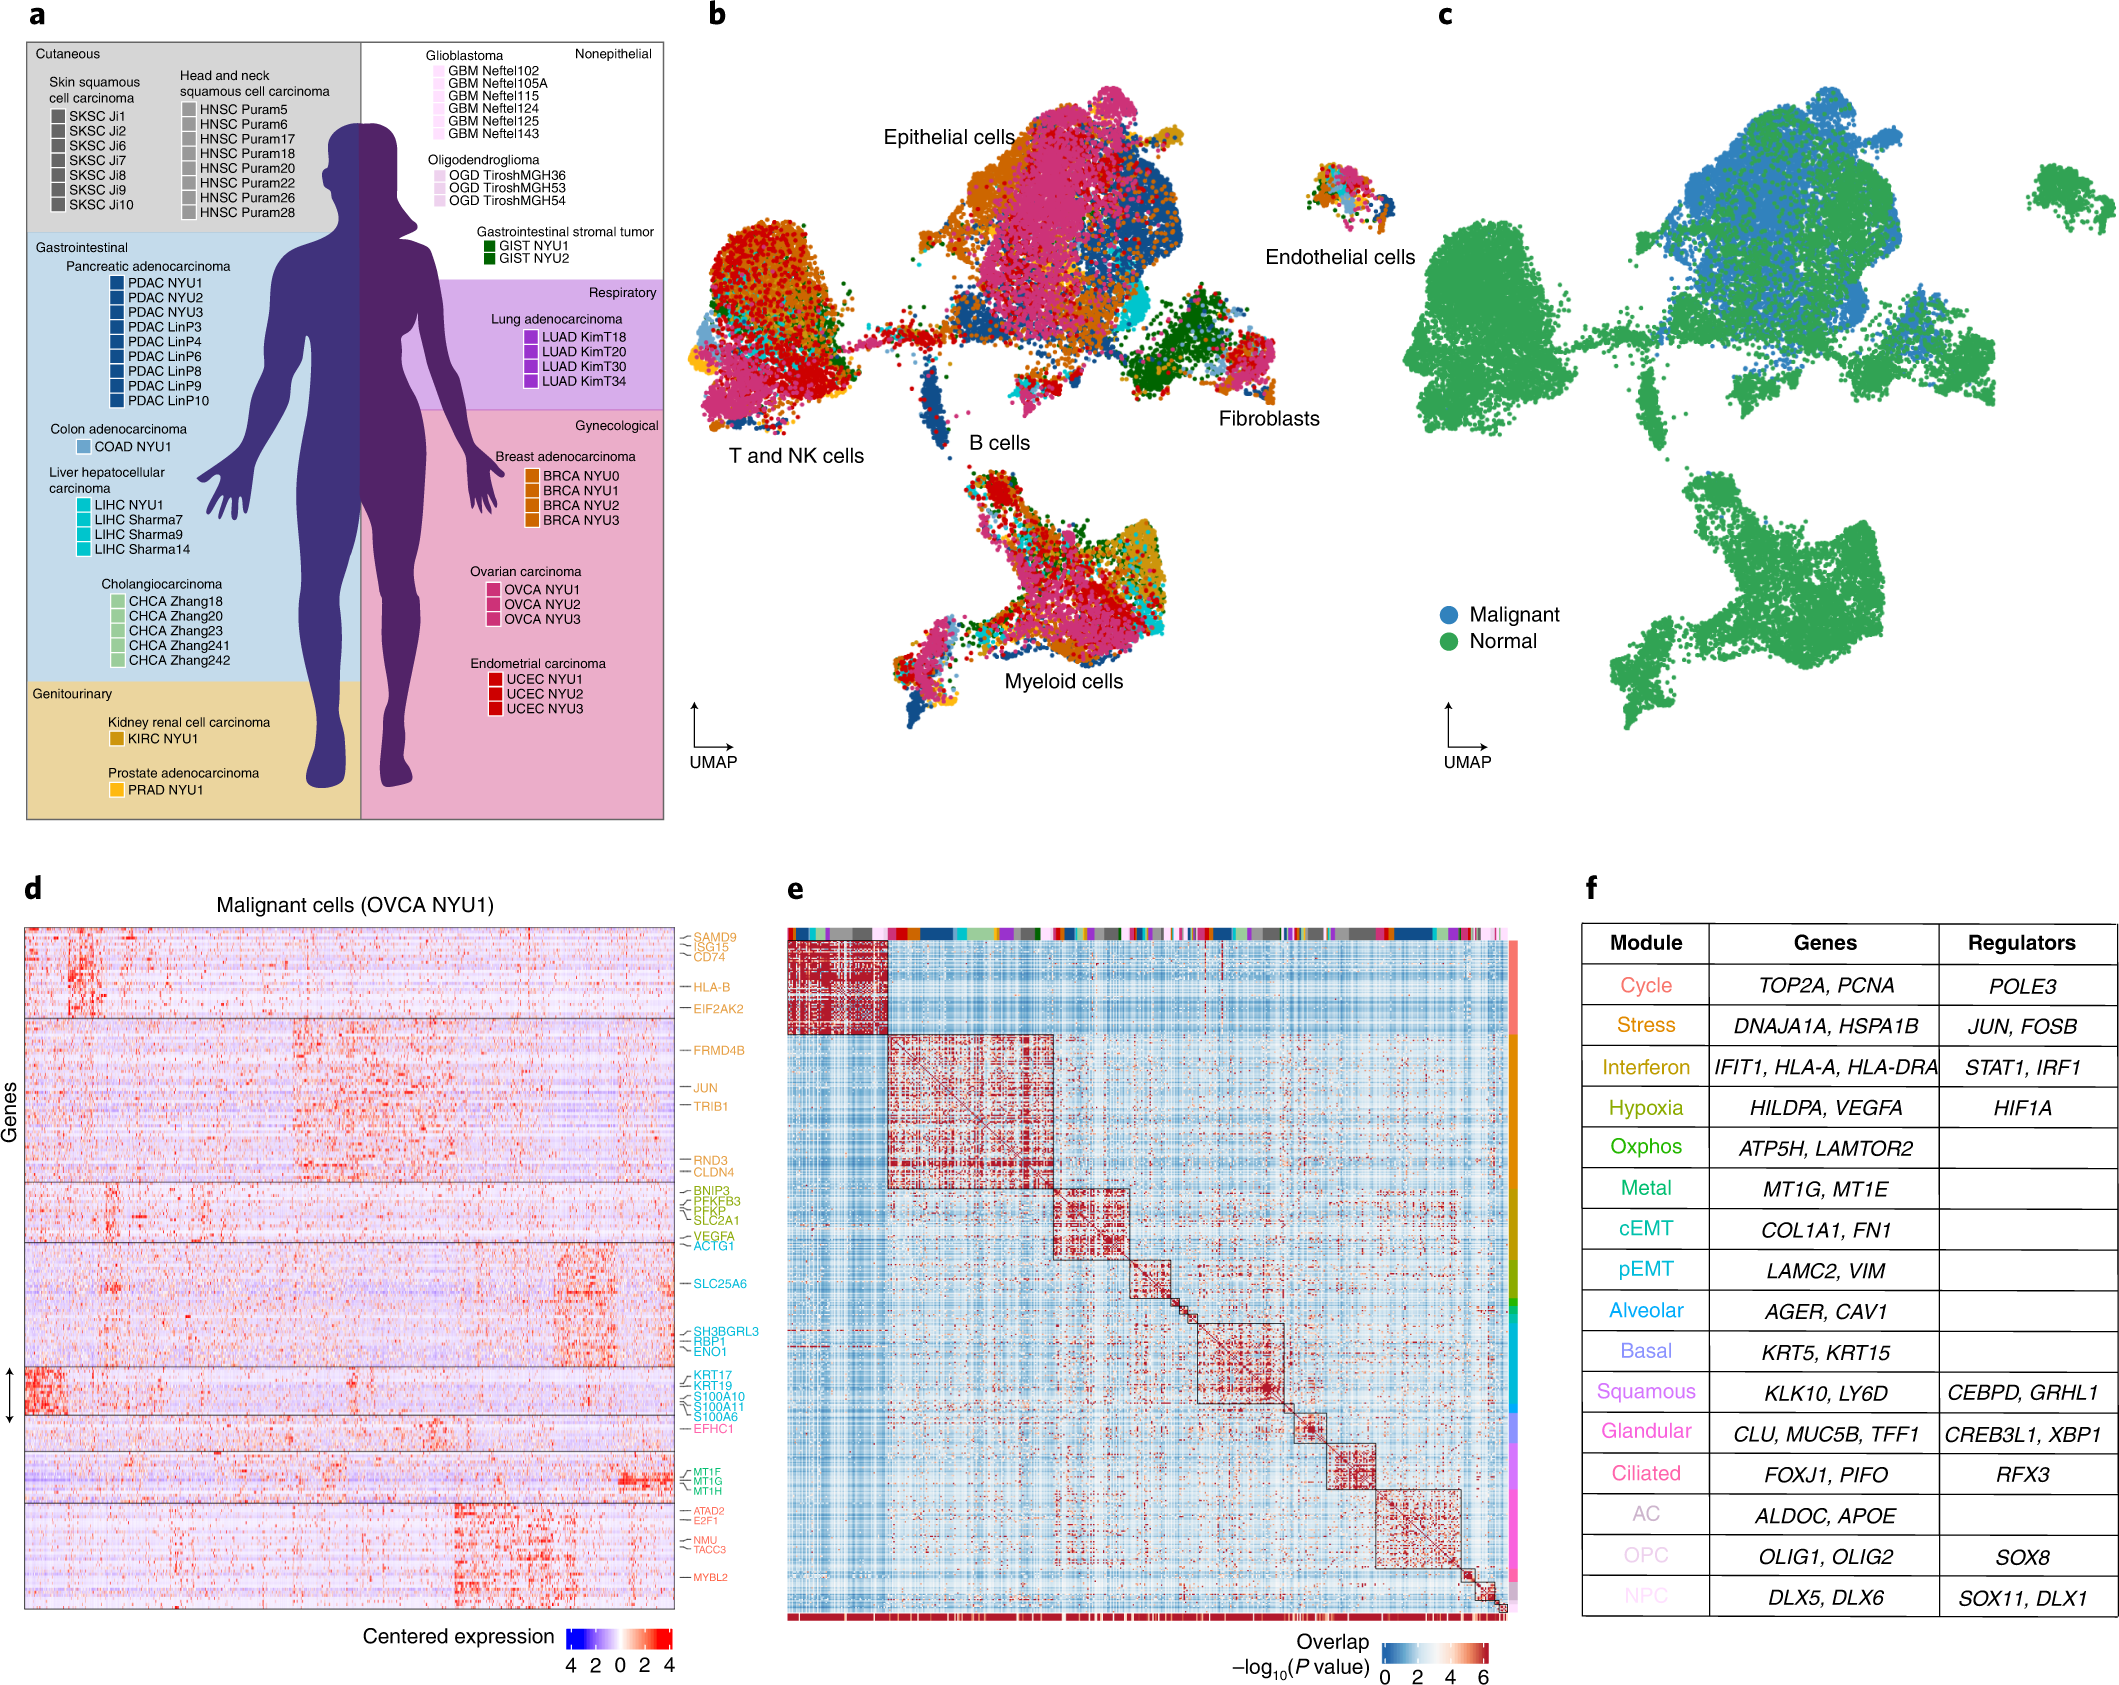
a, Schematic indicating tumors collected in this study and tumors included from previous reports for joint analysis. The background color indicates the organ system of origin: cutaneous (gray), gastrointestinal (blue), gynecological (red) and genitourinary (yellow). White background indicates nonepithelial tumors. b,c, Uniform manifold approximation and projection (UMAP) embedding of cells from the 19 tumors collected in this study spanning a total of nine cancer types, colored as in a (b) or by annotation as malignant or nonmalignant (c). d, Heatmap of expression levels for 241 genes in malignant cells of the ovarian tumor OVCA NYU1. Genes are ordered by their module membership (horizontal lines) and the colors of the indicated genes correspond to their consensus module annotation. e, Heatmap of the significance of the overlap between individual tumor modules (hypergeometric test P value). The bottom bar indicates the significance of the overlap with consensus modules (hypergeometric test P value). The top bar indicates the identity of the tumor samples, colored as in a. Extended Data Fig. 3h indicates the significance of the overlap of each consensus module with each tumor specific gene module. f, Table of consensus modules, selected genes and putative regulators identified using SCENIC (regulators identified in at least two tumors are shown), colored as in d.
Barkley D, Moncada R, Pour M, Liberman DA, Dryg I, Werba G, Wang W, Baron M, Rao A, Xia B, França GS, Weil A, Delair DF, Hajdu C, Lund AW, Osman I, Yanai I. (2022) Cancer cell states recur across tumor types and form specific interactions with the tumor microenvironment. Nat Genet 54(8):1192-1201. [abstract]


