

Most spatial transcriptomics technologies are limited by their resolution, with spot sizes larger than that of a single cell. Although joint analysis with single-cell RNA sequencing can alleviate this problem, current methods are limited to assessing discrete cell types, revealing the proportion of cell types inside each spot. To identify continuous variation of the transcriptome within cells of the same type, researchers from the University of California, Berkeley developed Deconvolution of Spatial Transcriptomics profiles using Variational Inference (DestVI). Using simulations, they demonstrate that DestVI outperforms existing methods for estimating gene expression for every cell type inside every spot. Applied to a study of infected lymph nodes and of a mouse tumor model, DestVI provides high-resolution, accurate spatial characterization of the cellular organization of these tissues and identifies cell-type-specific changes in gene expression between different tissue regions or between conditions.
Schematic representation of the ST analysis pipeline with DestVI
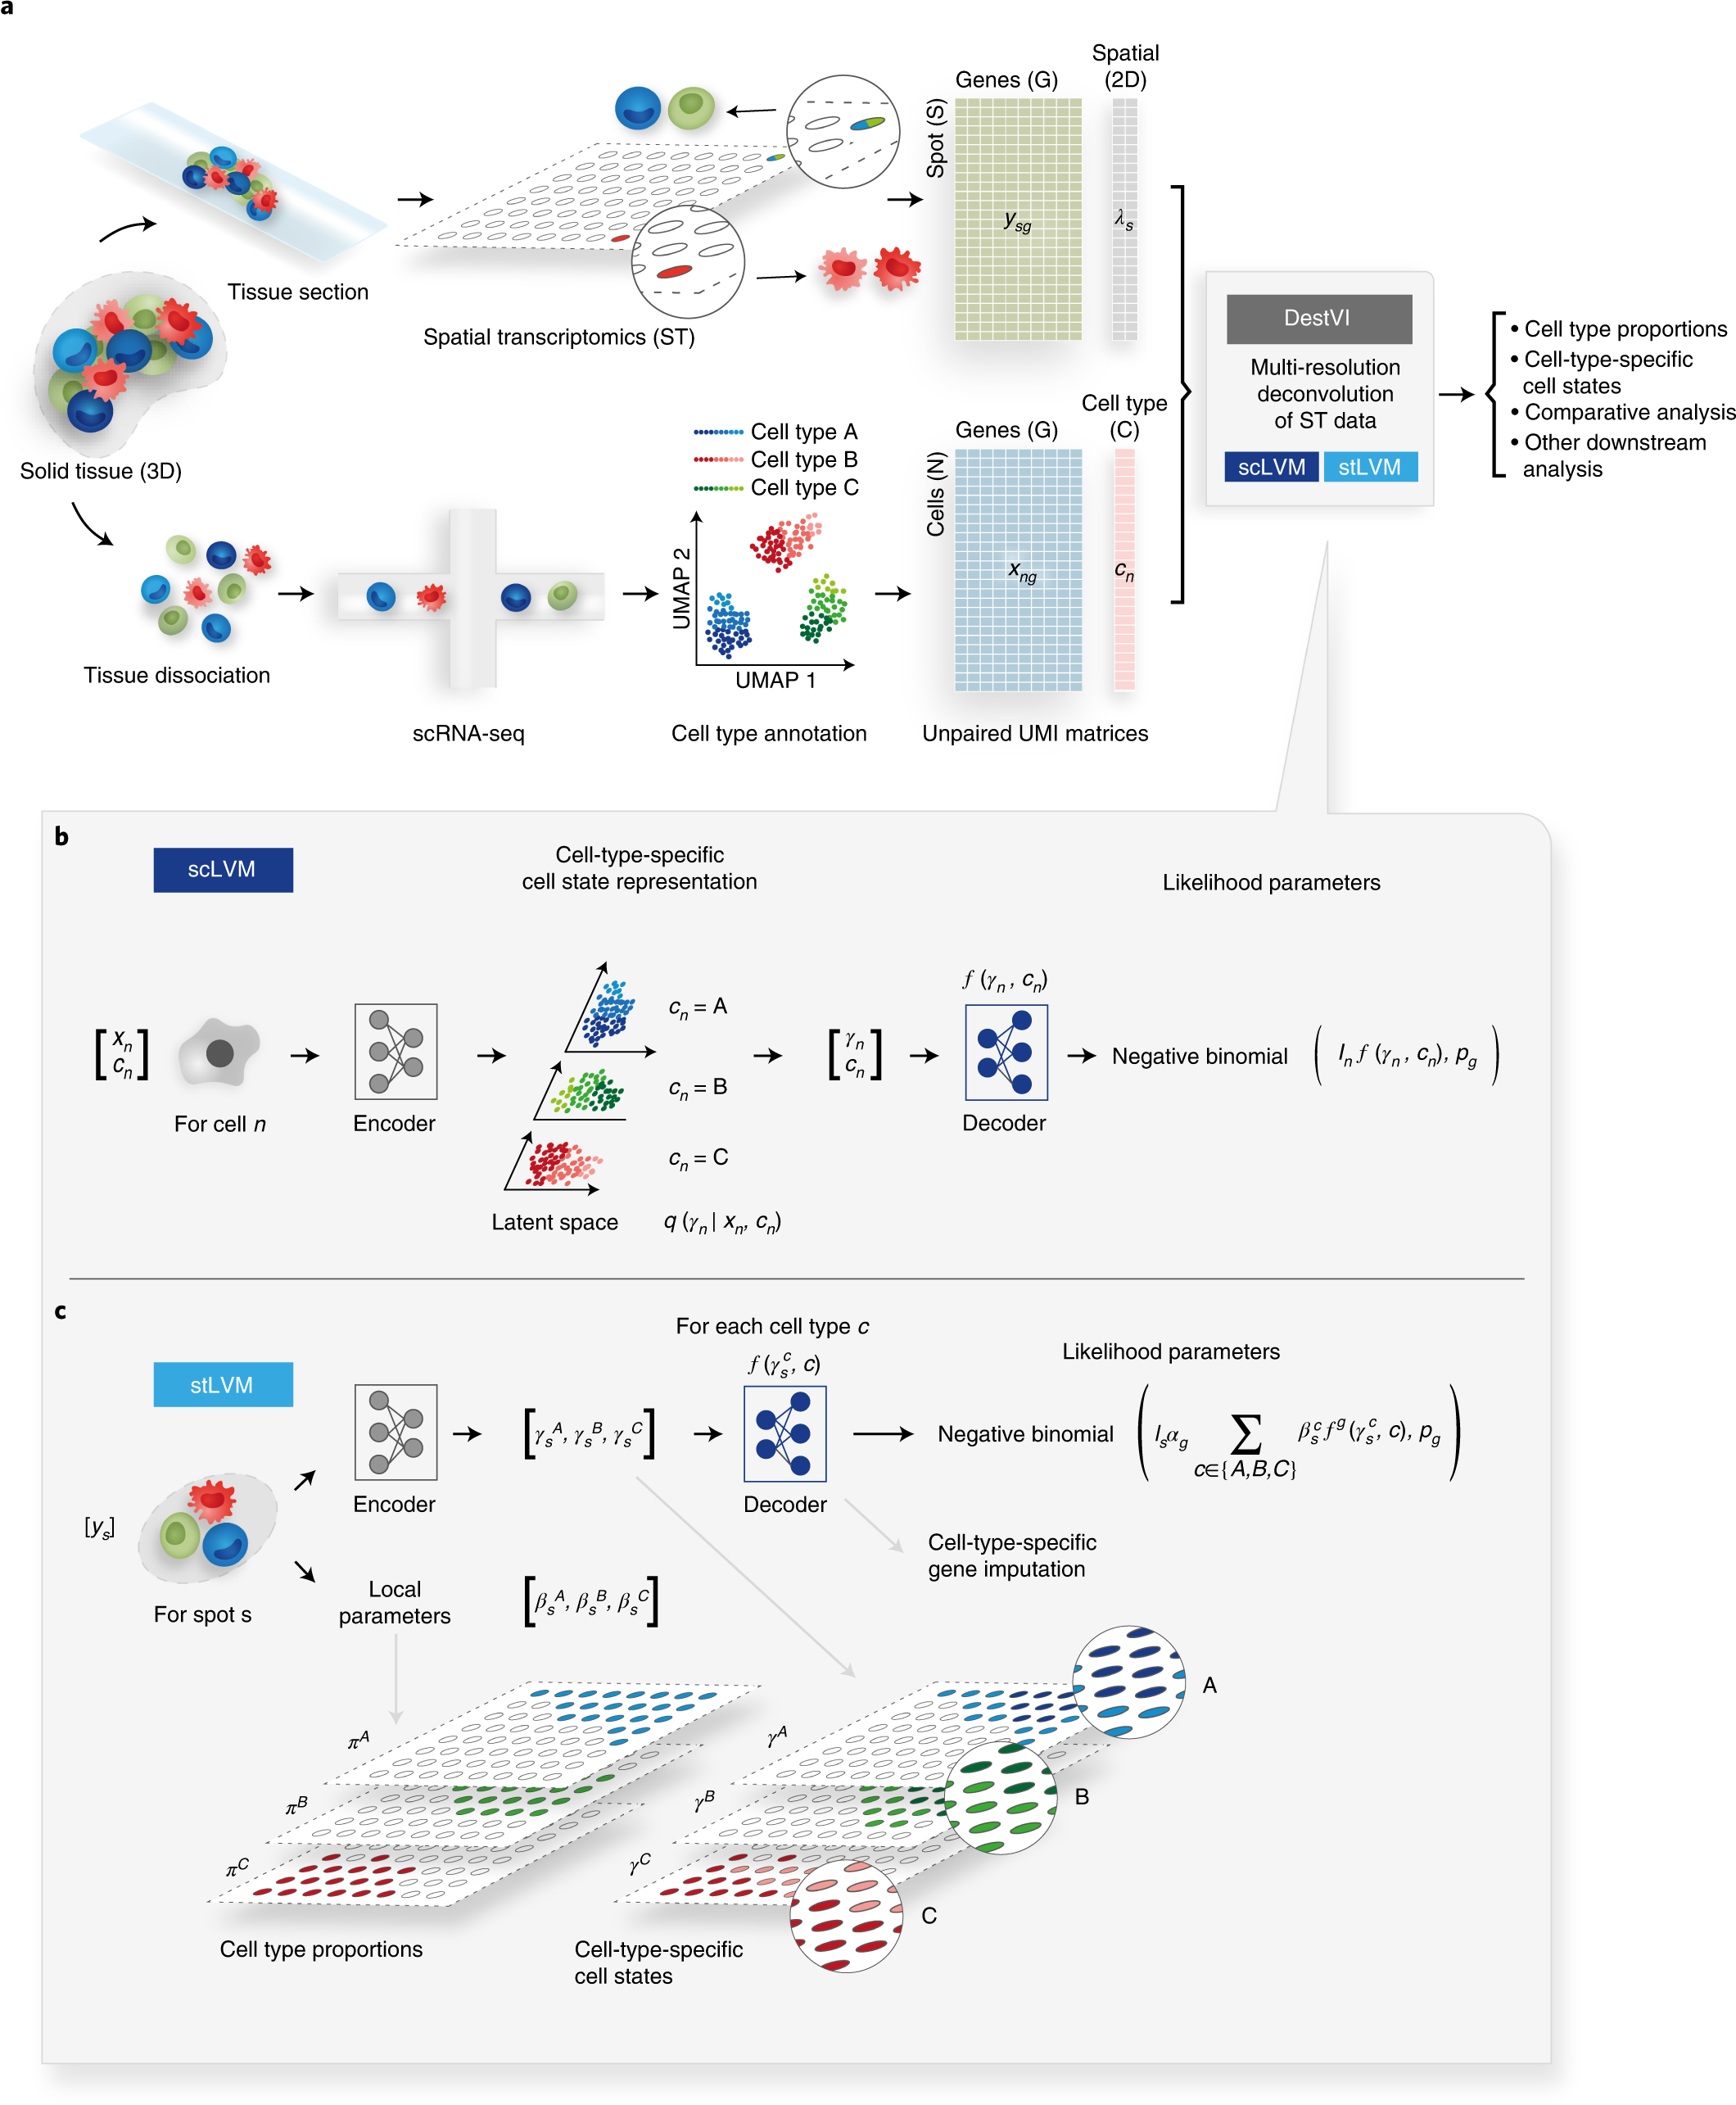
a, A ST analysis workflow relies on two data modalities, producing unpaired transcriptomic measurements, each in the form of count matrices. The ST data measures the gene expression ys in a given spot s and its location λs. However, each spot may contain multiple cells. The scRNA-seq data measure the gene expression xn in a cell n, but the spatial information is lost because of tissue dissociation. After annotation, we may associate each cell with a cell type cn. These matrices are the input to DestVI, composed of two LVMs: the scLVM and the stLVM. DestVI outputs a joint representation of the single-cell data and the spatial data by estimating the proportion of every cell type in every spot and projecting the expression of each spot onto cell-type-specific latent spaces. These inferred values may be used for performing downstream analysis, such as cell-type-specific DE and comparative analyses of conditions. b, Schematic of the scLVM. RNA counts and cell type information from the scRNA-seq data are jointly transformed by an encoder neural network into the parameters of the approximate posterior of γn, a low-dimensional representation of cell-type-specific cell state. Next, a decoder neural network maps samples from the approximate posterior of γn along with the cell type information cn to the parameters of a count distribution for every gene. The superscript notation fg denotes the g-th entry ρng of the vector ρn. c, Schematic of the stLVM. RNA counts from the ST data are transformed by an encoder neural network into the parameters of the cell-type-specific embeddings γcsγsc. Free parameters βcsβsc encode the abundance of cell type c in spot s and may be normalized into CTP πcsπsc. The decoder from the scLVM model maps cell-type-specific embeddings γcsγsc to estimates of cell-type-specific gene expression. These values are summed across all cell types, weighted by the abundance parameters βcsβsc, to obtain the parameter rsg approximating the gene expression of the spot. After training, the decoder may be used to perform cell-type-specific imputation of gene expression across all spots.
Availability – DestVI is available as part of the open-source software package scvi-tools (https://scvi-tools.org).
Lopez R, Li B, Keren-Shaul H, Boyeau P, Kedmi M, Pilzer D, Jelinski A, Yofe I, David E, Wagner A, Ergen C, Addadi Y, Golani O, Ronchese F, Jordan MI, Amit I, Yosef N. (2022) DestVI identifies continuums of cell types in spatial transcriptomics data. Nat Biotechnol [ Epub ahead of print]. [article]


