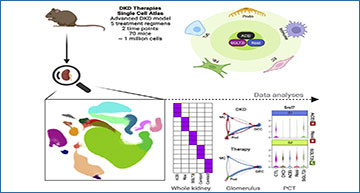
Diabetic kidney disease (DKD) occurs in ∼40% of patients with diabetes and causes kidney failure, cardiovascular disease, and premature death. Researchers at Washington University in St. Louis analyzed the response of a murine DKD model to five treatment regimens using single-cell RNA sequencing (scRNA-seq). Their atlas of ∼1 million cells revealed a heterogeneous response of all kidney cell types both to DKD and its treatment. Both monotherapy and combination therapies targeted differing cell types and induced distinct and non-overlapping transcriptional changes. The early effects of sodium-glucose cotransporter-2 inhibitors (SGLT2i) on the S1 segment of the proximal tubule suggest that this drug class induces fasting mimicry and hypoxia responses. Diabetes downregulated the spliceosome regulator serine/arginine-rich splicing factor 7 (Srsf7) in proximal tubule that was specifically rescued by SGLT2i. In vitro proximal tubule knockdown of Srsf7 induced a pro-inflammatory phenotype, implicating alternative splicing as a driver of DKD and suggesting SGLT2i regulation of proximal tubule alternative splicing as a potential mechanism of action for this drug class.
A total of 946,660 high-quality cells from 70 mouse kidneys in 14 different groups are projected by uniform manifold approximation and projection (UMAP) plot. Colors indicate the major kidney cell types, and cluster boundaries are outlined by contour curve. The four corner insets show subclusters of endothelial cells, immune cells, fibroblasts, and thick ascending limb (TAL) of loop of Henle. The axis outside the circular plot depicts the log scale of the total cell number for each cell class. The four colored tracks (from outside to inside) indicate class (colored as the central UMAP), group ID, mouse ID, and marker gene expression. Legends denote the group design (left) and marker genes (right) to define each cell class. The left legend shows the group ID/colors for the group ID track. The right legend shows marker genes/colors used for the marker track.D
Availability – A searchable database, including gene expression in all kidney cell types, glomerular cell types, and PCT cell types is available at the Kidney Interactive Transcriptomics (K.I.T.) Website: http://humphreyslab.com/SingleCell/.
Wu H, Villalobos RG, Yao X, Reilly D, Chen T, Rankin M, Myshkin E, Breyer MD, Humphreys BD. (2022) Mapping the single-cell transcriptomic response of murine diabetic kidney disease to therapies. Cell Metabolism [Epub ahead of print]. [article]


