

Improved scale, multiplexing and resolution are establishing spatial nucleic acid and protein profiling methods as a major pillar for cellular atlas building of complex samples, from tissues to full organisms. Emerging methods yield omics measurements at resolutions covering the nano- to microscale, enabling the charting of cellular heterogeneity, complex tissue architectures and dynamic changes during development and disease. A team led by researchers at Boston Children’s Hospital present an overview of the developing landscape of in situ spatial genome, transcriptome and proteome technologies, exemplify their impact on cell biology and translational research, and discuss current challenges for their community-wide adoption. Among many transformative applications, the researchers envision that spatial methods will map entire organs and enable next-generation pathology.
An overview of imaging-based spatial transcriptomics methods and their performance
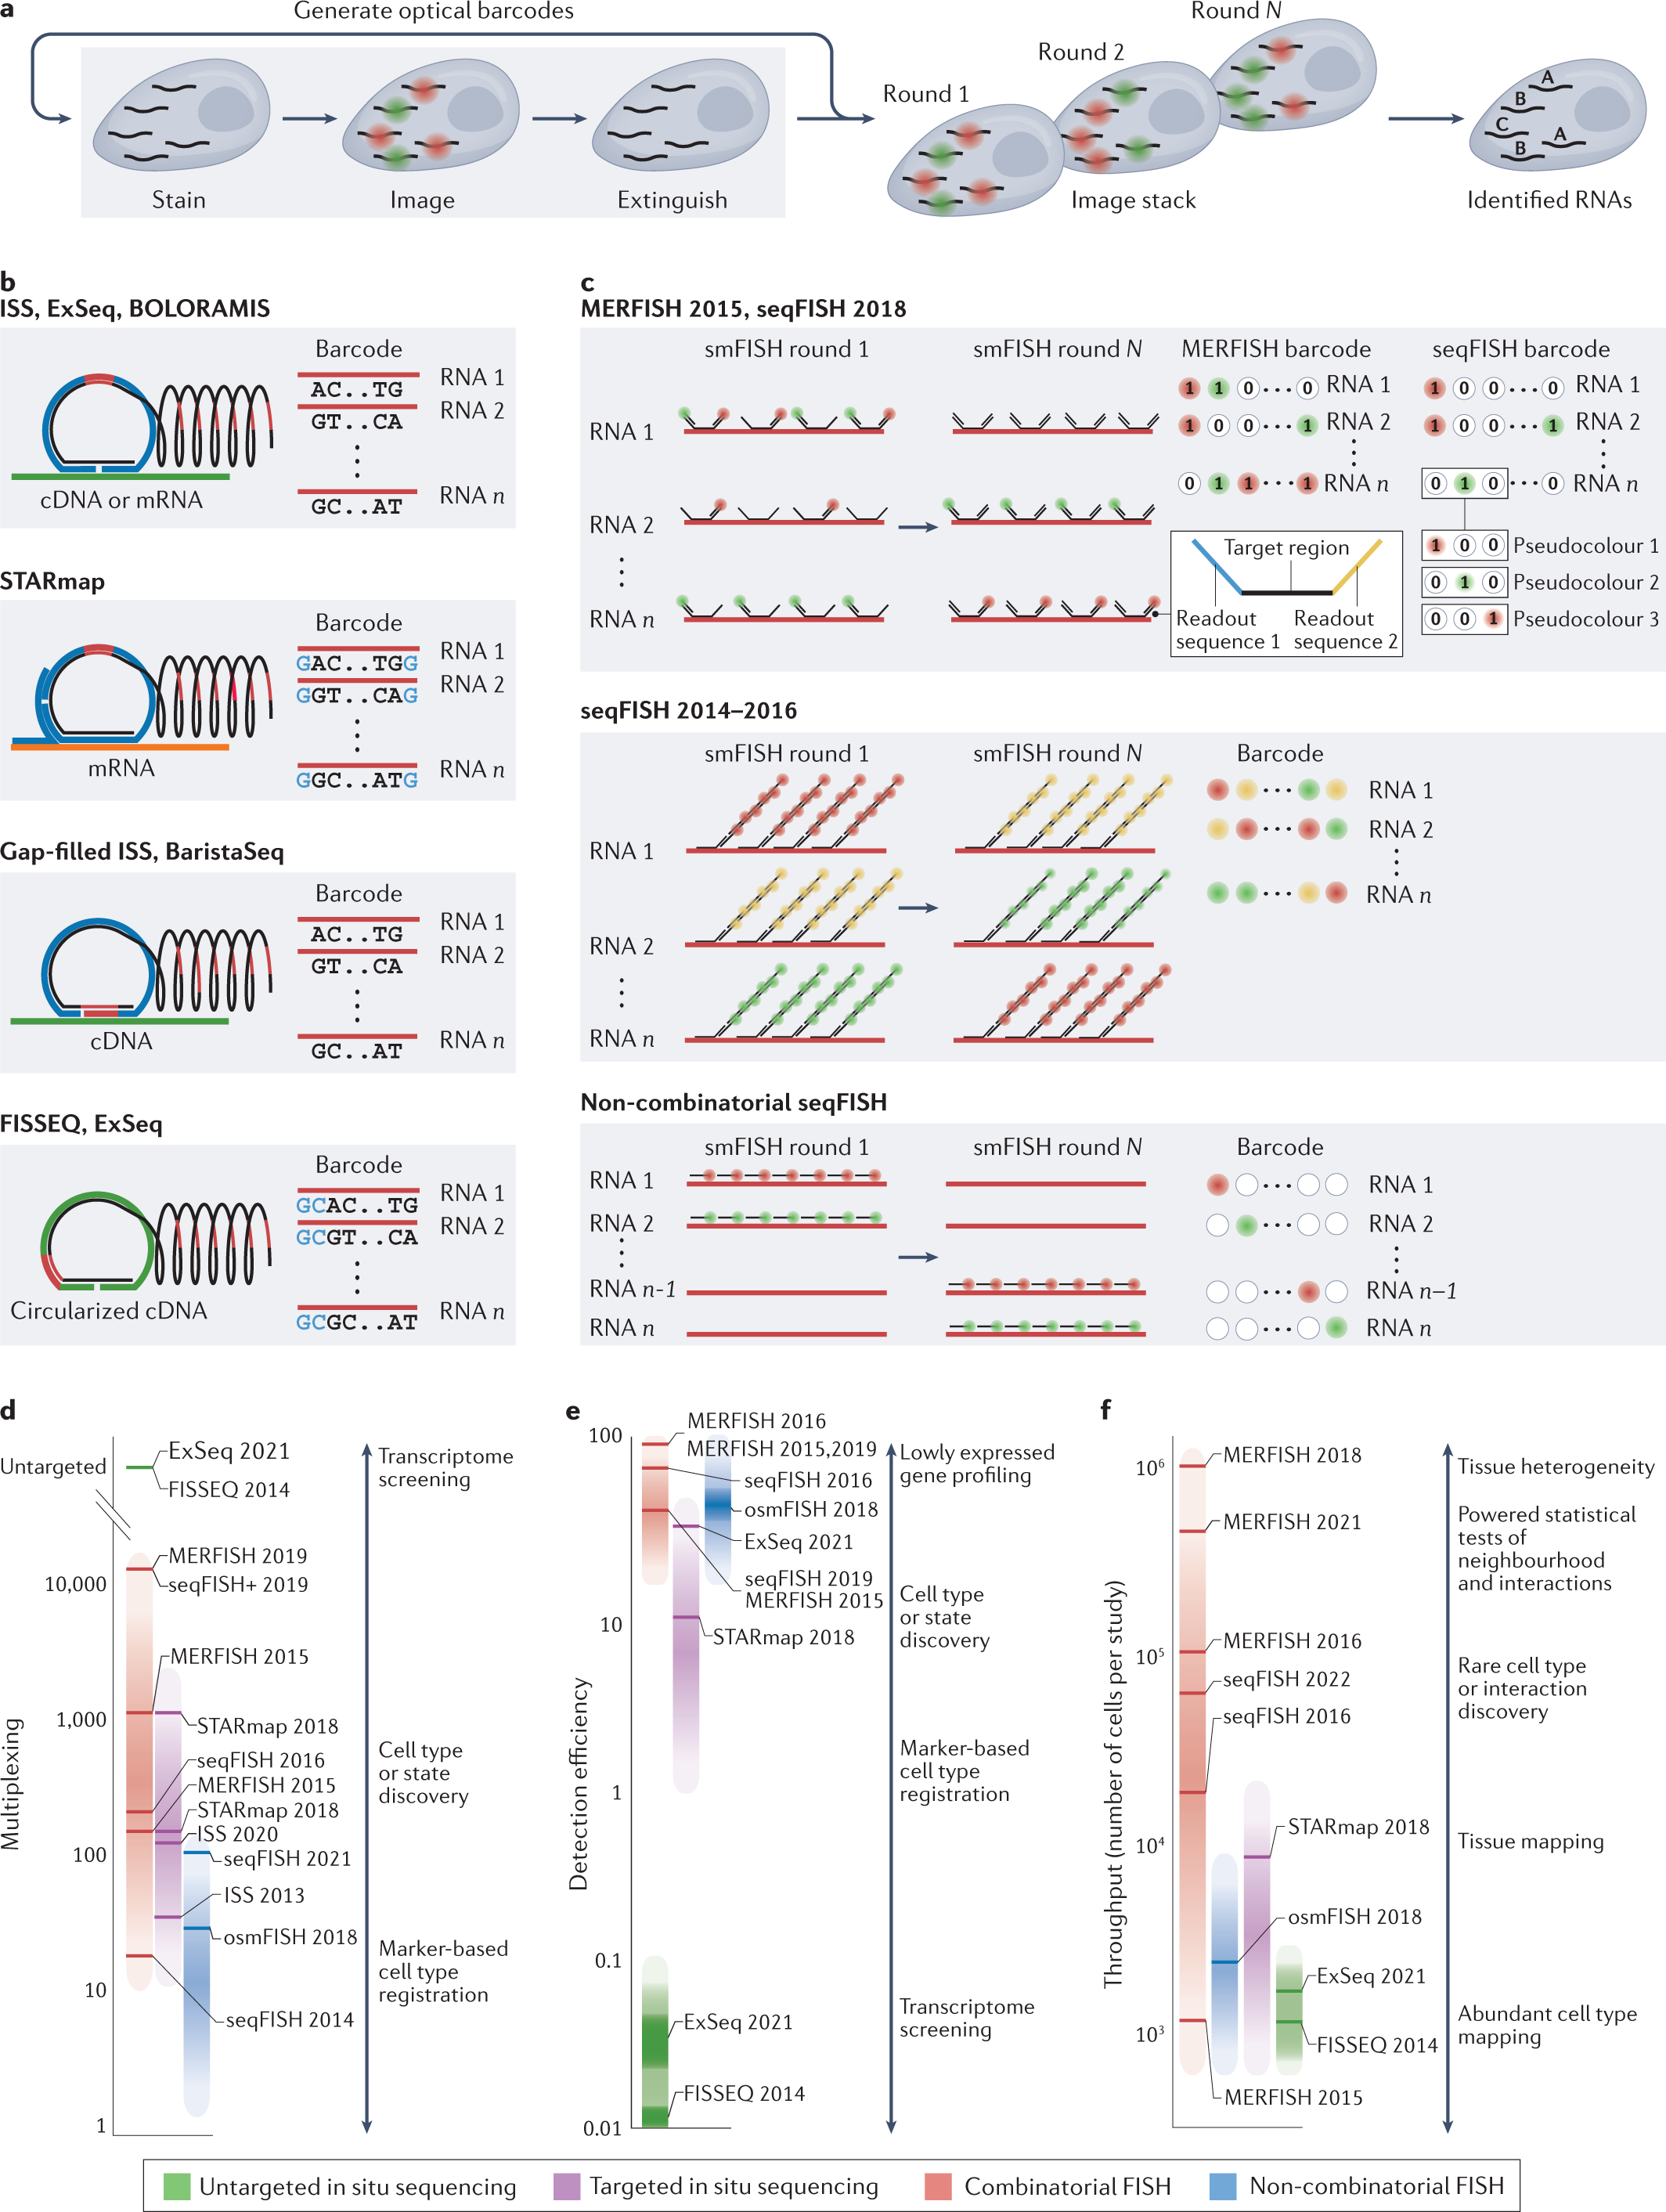
a | Schematic depiction of the creation of fluorescent signals from individual molecules and the construction of optical barcodes through the repetitive process of single-colour or multicolour fluorescence generation, imaging and signal removal. These optical barcodes can then be used to identify individual RNAs. b,c | Schematic depiction of the methods that are used to generate optical barcodes and the properties of these barcodes for a selection of in situ sequencing-based (part b) or fluorescence in situ hybridization (FISH)-based (part c) methods. With in situ sequencing-based methods, fluorescence is generated by the incorporation of fluorescently labelled nucleotides or via ligation of short fluorescently labelled oligonucleotides, that is, sequencing-by-synthesis or sequencing-by-ligation chemistries. The fluorescent patterns, in turn, reveal individual nucleotide sequences, which are, in effect, the barcodes that are used to discriminate different RNAs. Within FISH-based methods, fluorescence is generated by the hybridization of fluorescently labelled oligonucleotide probes and this process can be used to create various fluorescent on-and-off patterns that, in turn, represent barcodes. Multiplexed error-robust FISH (MERFISH) uses binary barcodes to represent RNAs, built from the on-off fluorescent pattern across multiple single or multicolour images. Early sequential FISH (seqFISH) implementations used a colorimetric barcoding scheme, in which each RNA was labelled with one colour in each round. Later seqFISH implementations group multiple imaging rounds to create pseudocolours, in which an RNA is fluorescent in only one image out of the set. The depicted methods should be considered representative but not comprehensive of signal generation and barcoding methods. d–f | Important performance metrics for image-based transcriptomic methods (distinct colours), including multiplexing (part d), detection efficiency (part e) and throughput (part f). Multiplexing is the number of measurable RNAs; detection efficiency is defined as the fraction of any given molecule actually detected (although we note that methods differ as to the technique used for ground truth, and the listed values and ranges reflect uncertainty in these numbers for different techniques); and throughput is the number of cells characterized by each technique, here estimated by the number of cells reported for individual studies. Different techniques vary in these different performance metrics, which, in turn, shapes the types of biological question (examples listed) that can be addressed. Labelled bars represent a subset of reported studies selected to illustrate the performance range of given techniques and their evolution over time. Importantly, not all metrics are reported for all studies nor are all metrics calculated in the same ways. Therefore, the location of highlighted bars should be considered as approximate estimations of performance, and where numbers are not reported we have estimated a range for these values. ExSeq, expansion sequencing; FISSEQ, fluorescence in situ sequencing; ISS, in situ sequencing; smFISH, single-molecule FISH; STARmap, spatially resolved transcript amplicon readout mapping.
Moffitt JR, Lundberg E, Heyn H. (2022) The emerging landscape of spatial profiling technologies. Nat Rev Genet [Epub ahead of print]. [abstract]


