

A new statistical method provides a more efficient way to uncover biologically meaningful changes in genomic data that span multiple conditions — such as cell types or tissues.
Whole genome studies produce enormous amounts of data, ranging from millions of individual DNA sequences to information about where and how many of the thousands of genes are expressed to the location of functional elements across the genome. Because of the amount and complexity of the data, comparing different biological conditions or across studies performed by separate laboratories can be statistically challenging.
“The difficulty when you have multiple conditions is how to analyze the data together in a way that can be both statistically powerful and computationally efficient,” said Qunhua Li, associate professor of statistics at Penn State. “Existing methods are computationally expensive or produce results that are difficult to interpret biologically. We developed a method called CLIMB that improves on existing methods, is computationally efficient, and produces biologically interpretable results. We test the method on three types of genomic data collected from hematopoietic cells — related to blood stem cells — but the method could also be used in analyses of other ‘omic’ data.”
The researchers describe the CLIMB (Composite LIkelihood eMpirical Bayes) method in a paper appearing online Nov. 12 in the journal Nature Communications.
Toy example of CLIMB
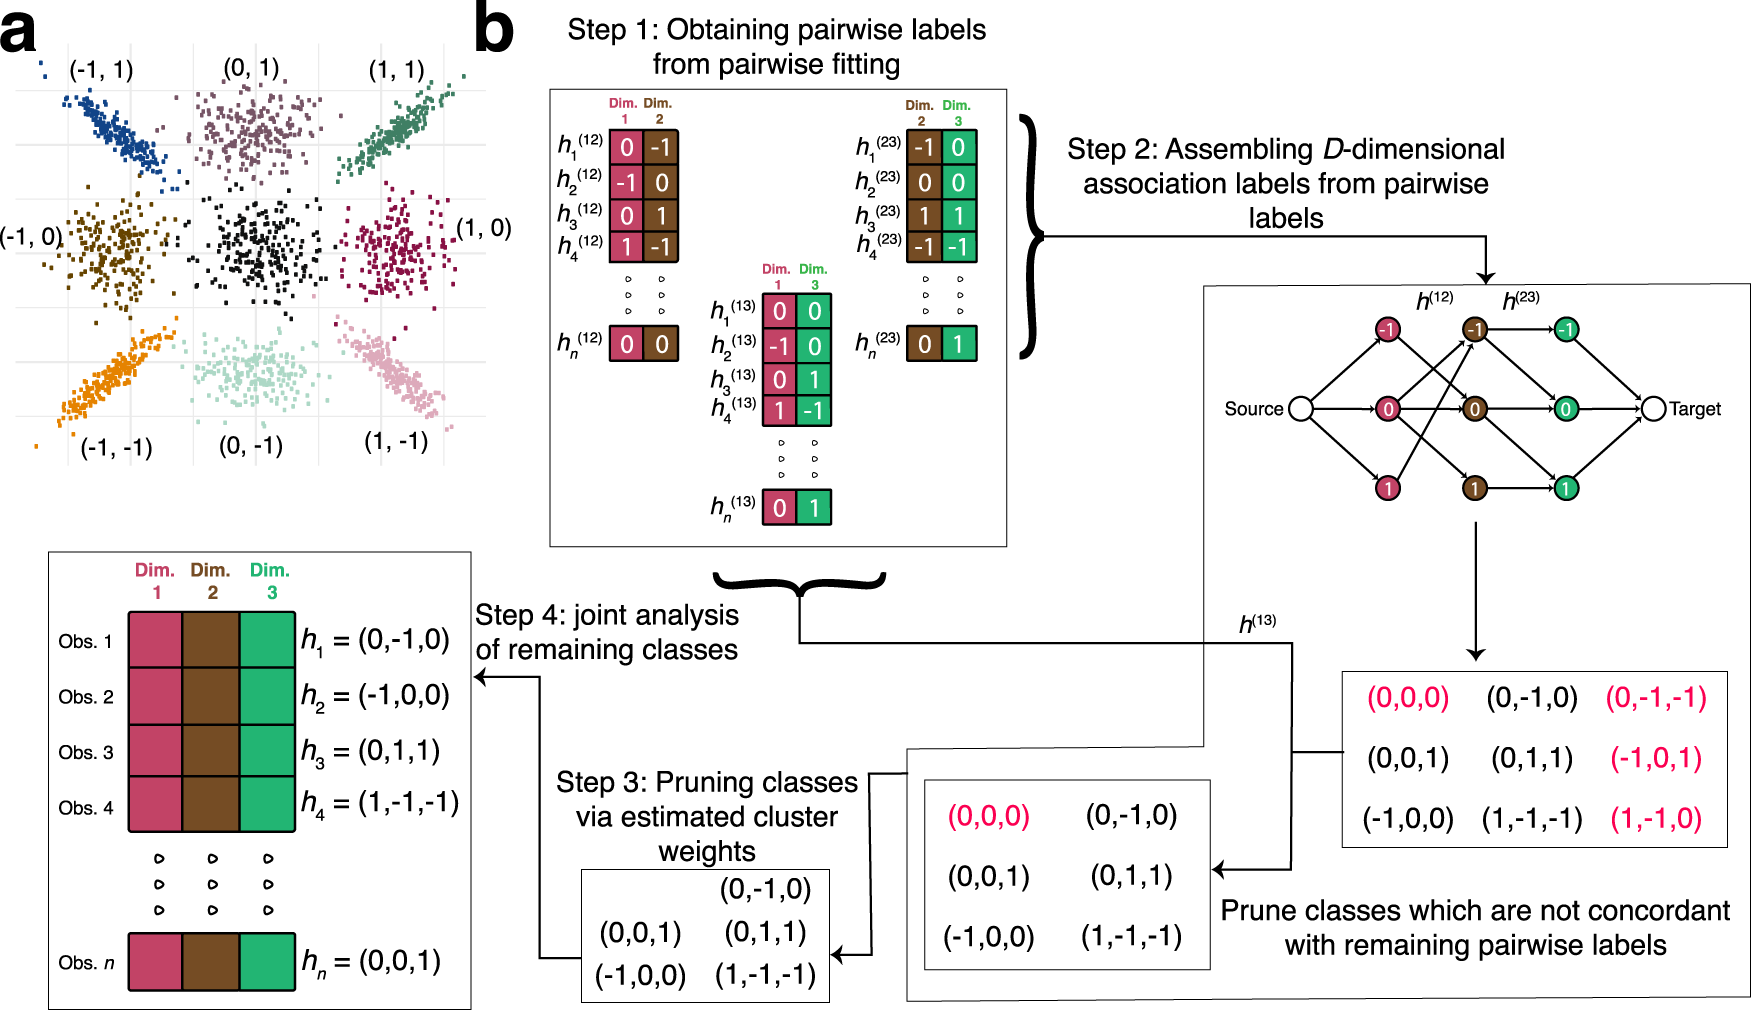
a Illustration of the considered model using a simulated dataset with two dimensions. The 9 classes are annotated by their corresponding latent association vectors. The null class (0, 0) lies in the center over the origin. Classes that are non-null in at least one dimension exhibit a location shift. Only observations from classes that are non-null in both dimensions are correlated. b Flowchart of CLIMB with a 3-dimensional example, with true classes whose association vectors are denoted h1, h2, h3, h4, and hn. Step 1 fits 3 pairwise models. Pairwise association vectors are estimated for each observation in each pairwise fit. In Step 2, we enumerate candidate 3-dimensional association vectors using a graph-based algorithm based on the estimated pairwise association vectors (shown as edges) between dimensions 1 and 2, and the estimated pairwise association vectors between dimensions 2 and 3. 9 candidate association vectors are found on the graph, but those that are colored in red are not truly present in the data. Association vectors that are not concordant with estimated association vectors from the pairwise fit between dimensions 1 and 3 are pruned. With 6 remaining candidates, one computes their prior weights (Step 3), then in Step 4 fits a Bayesian mixture model to the original, 3-dimensional data using the number of classes remaining after Step 3.
“In experiments where there is so much information but from relatively few individuals, it helps to be able to use information as efficiently as possible,” said Hillary Koch, a graduate student at Penn State at the time of the research and now a senior statistician at Moderna. “There are statistical advantages to be able to look at everything together and even to use information from related experiments. CLIMB allows us to do just that.”
The CLIMB method uses principles from two traditional techniques to analyze data across multiple conditions. One technique uses a series of pairwise comparisons between conditions but becomes increasingly challenging to interpret as additional conditions are added.
A different technique combines each subject’s activity pattern across conditions into an “association vector,” for example, a gene being up-regulated, down-regulated, or with no change in each of many cell types. The association vector directly reflects the pattern of condition specificity and is easy to interpret. However, because many different combinations are possible even when there are only a handful of conditions, the calculations are extremely computationally intense. To overcome this challenge, this second approach on its own makes assumptions about how to simplify the data that are not always correct.
“CLIMB uses aspects of both of these approaches,” said Koch. “We ultimately analyze association vectors, but first we use pairwise analyses to identify the patterns that are likely to exist up front. Rather than making assumptions about the data, we use the pairwise information to eliminate combinations that the data don’t strongly support. This dramatically reduces the space of possible patterns across conditions that would otherwise make the computations so intensive.”
After compiling the reduced set of possible association vectors, the method clusters together subjects that follow the same pattern across conditions. For example, the results could tell researchers sets of genes that are collectively up-regulated in some cell types, but down-regulated in others.
The researchers tested their method on data collected from experiments using a technology called RNA-seq, which can measure the amount of RNA made from all the genes being expressed in a cell, to examine whether certain genes help determine which types of cells the hematopoietic stem cell ultimately turns into.
“Compared to the popular pair-wise method, our results are more specific,” said Li. “Our gene list is more succinct and biologically more relevant.”
While the traditional pair-wise method identified six to seven thousand genes of interest, CLIMB produced a much narrower list of two to three thousand genes, with at least a thousand of those genes identified in both analyses.
“The different blood cell types have a variety of functions — some become red blood cells and others become immune cells — and we wanted to know which genes are more likely to be involved in determining each distinct cell types,” said Ross Hardison, T. Ming Chu Professor of Biochemistry and Molecular Biology at Penn State. “The CLIMB approach pulled out some important genes; some of them we already knew about and others add to what we know. But the difference is these results were a lot more specific and a lot more interpretable than those from previous analyses.”
The researchers also used CLIMB on data produced from a different experimental technology, ChIP-seq, that can identify where along the genome certain proteins bind to the DNA. They explored how the binding of a protein called CTCF — a transcription factor that helps establish interactions needed for gene regulation in the cell nucleus — does or does not change across 17 cells populations that all derive from the same hematopoietic stem cell. The CLIMB analysis identified distinct categories of CTCF-bound sites, some that reveal roles for this transcription factor in all blood cells and others showing roles in specific cell types.
Lastly, the team explored data from a yet another experimental technology, called DNase-seq, which can identify locations of regulatory regions, to compare accessibility of chromatin — a complex of DNA and proteins — in 38 human cell types.
“For all three tests, we wanted to see if our results had biological relevance, so we compared our results against independent data, such as studies of high-throughput sequencing of histone modifications and transcription factor footprinting.” said Koch. “In each case, our results correspond with these other methods. Next, we would like to improve the computational speed of our method and increase the number of conditions it can handle. For example, chromatin-accessibility data are available for many more cell types, so we’d love to increase the scale of CLIMB.”
Source – Penn State University
Koch H, Keller CA, Xiang G, Giardine B, Zhang F, Wang Y, Hardison RC, Li Q. (2022) CLIMB: High-dimensional association detection in large scale genomic data. Nat Commun 13(1):6874. [article]


