

Effective dimension reduction is essential for single cell RNA-seq (scRNAseq) analysis. Principal component analysis (PCA) is widely used, but requires continuous, normally-distributed data; therefore, it is often coupled with log-transformation in scRNAseq applications, which can distort the data and obscure meaningful variation. Researchers from the Harvard TH Chan School of Public Health describe correspondence analysis (CA), a count-based alternative to PCA. CA is based on decomposition of a chi-squared residual matrix, avoiding distortive log-transformation. To address overdispersion and high sparsity in scRNAseq data, the researchers propose five adaptations of CA, which are fast, scalable, and outperform standard CA and glmPCA, to compute cell embeddings with more performant or comparable clustering accuracy in 8 out of 9 datasets. In particular, they found that CA with Freeman-Tukey residuals performs especially well across diverse datasets. Other advantages of the CA framework include visualization of associations between genes and cell populations in a “CA biplot,” and extension to multi-table analysis; they introduce corralm for integrative multi-table dimension reduction of scRNAseq data. The researchers implement CA for scRNAseq data in corral, an R/Bioconductor package which interfaces directly with single cell classes in Bioconductor. Switching from PCA to CA is achieved through a simple pipeline substitution and improves dimension reduction of scRNAseq datasets.
Correspondence Analysis (CA) is an alternative to PCA for count data that is robust for use with raw and log-normalized count
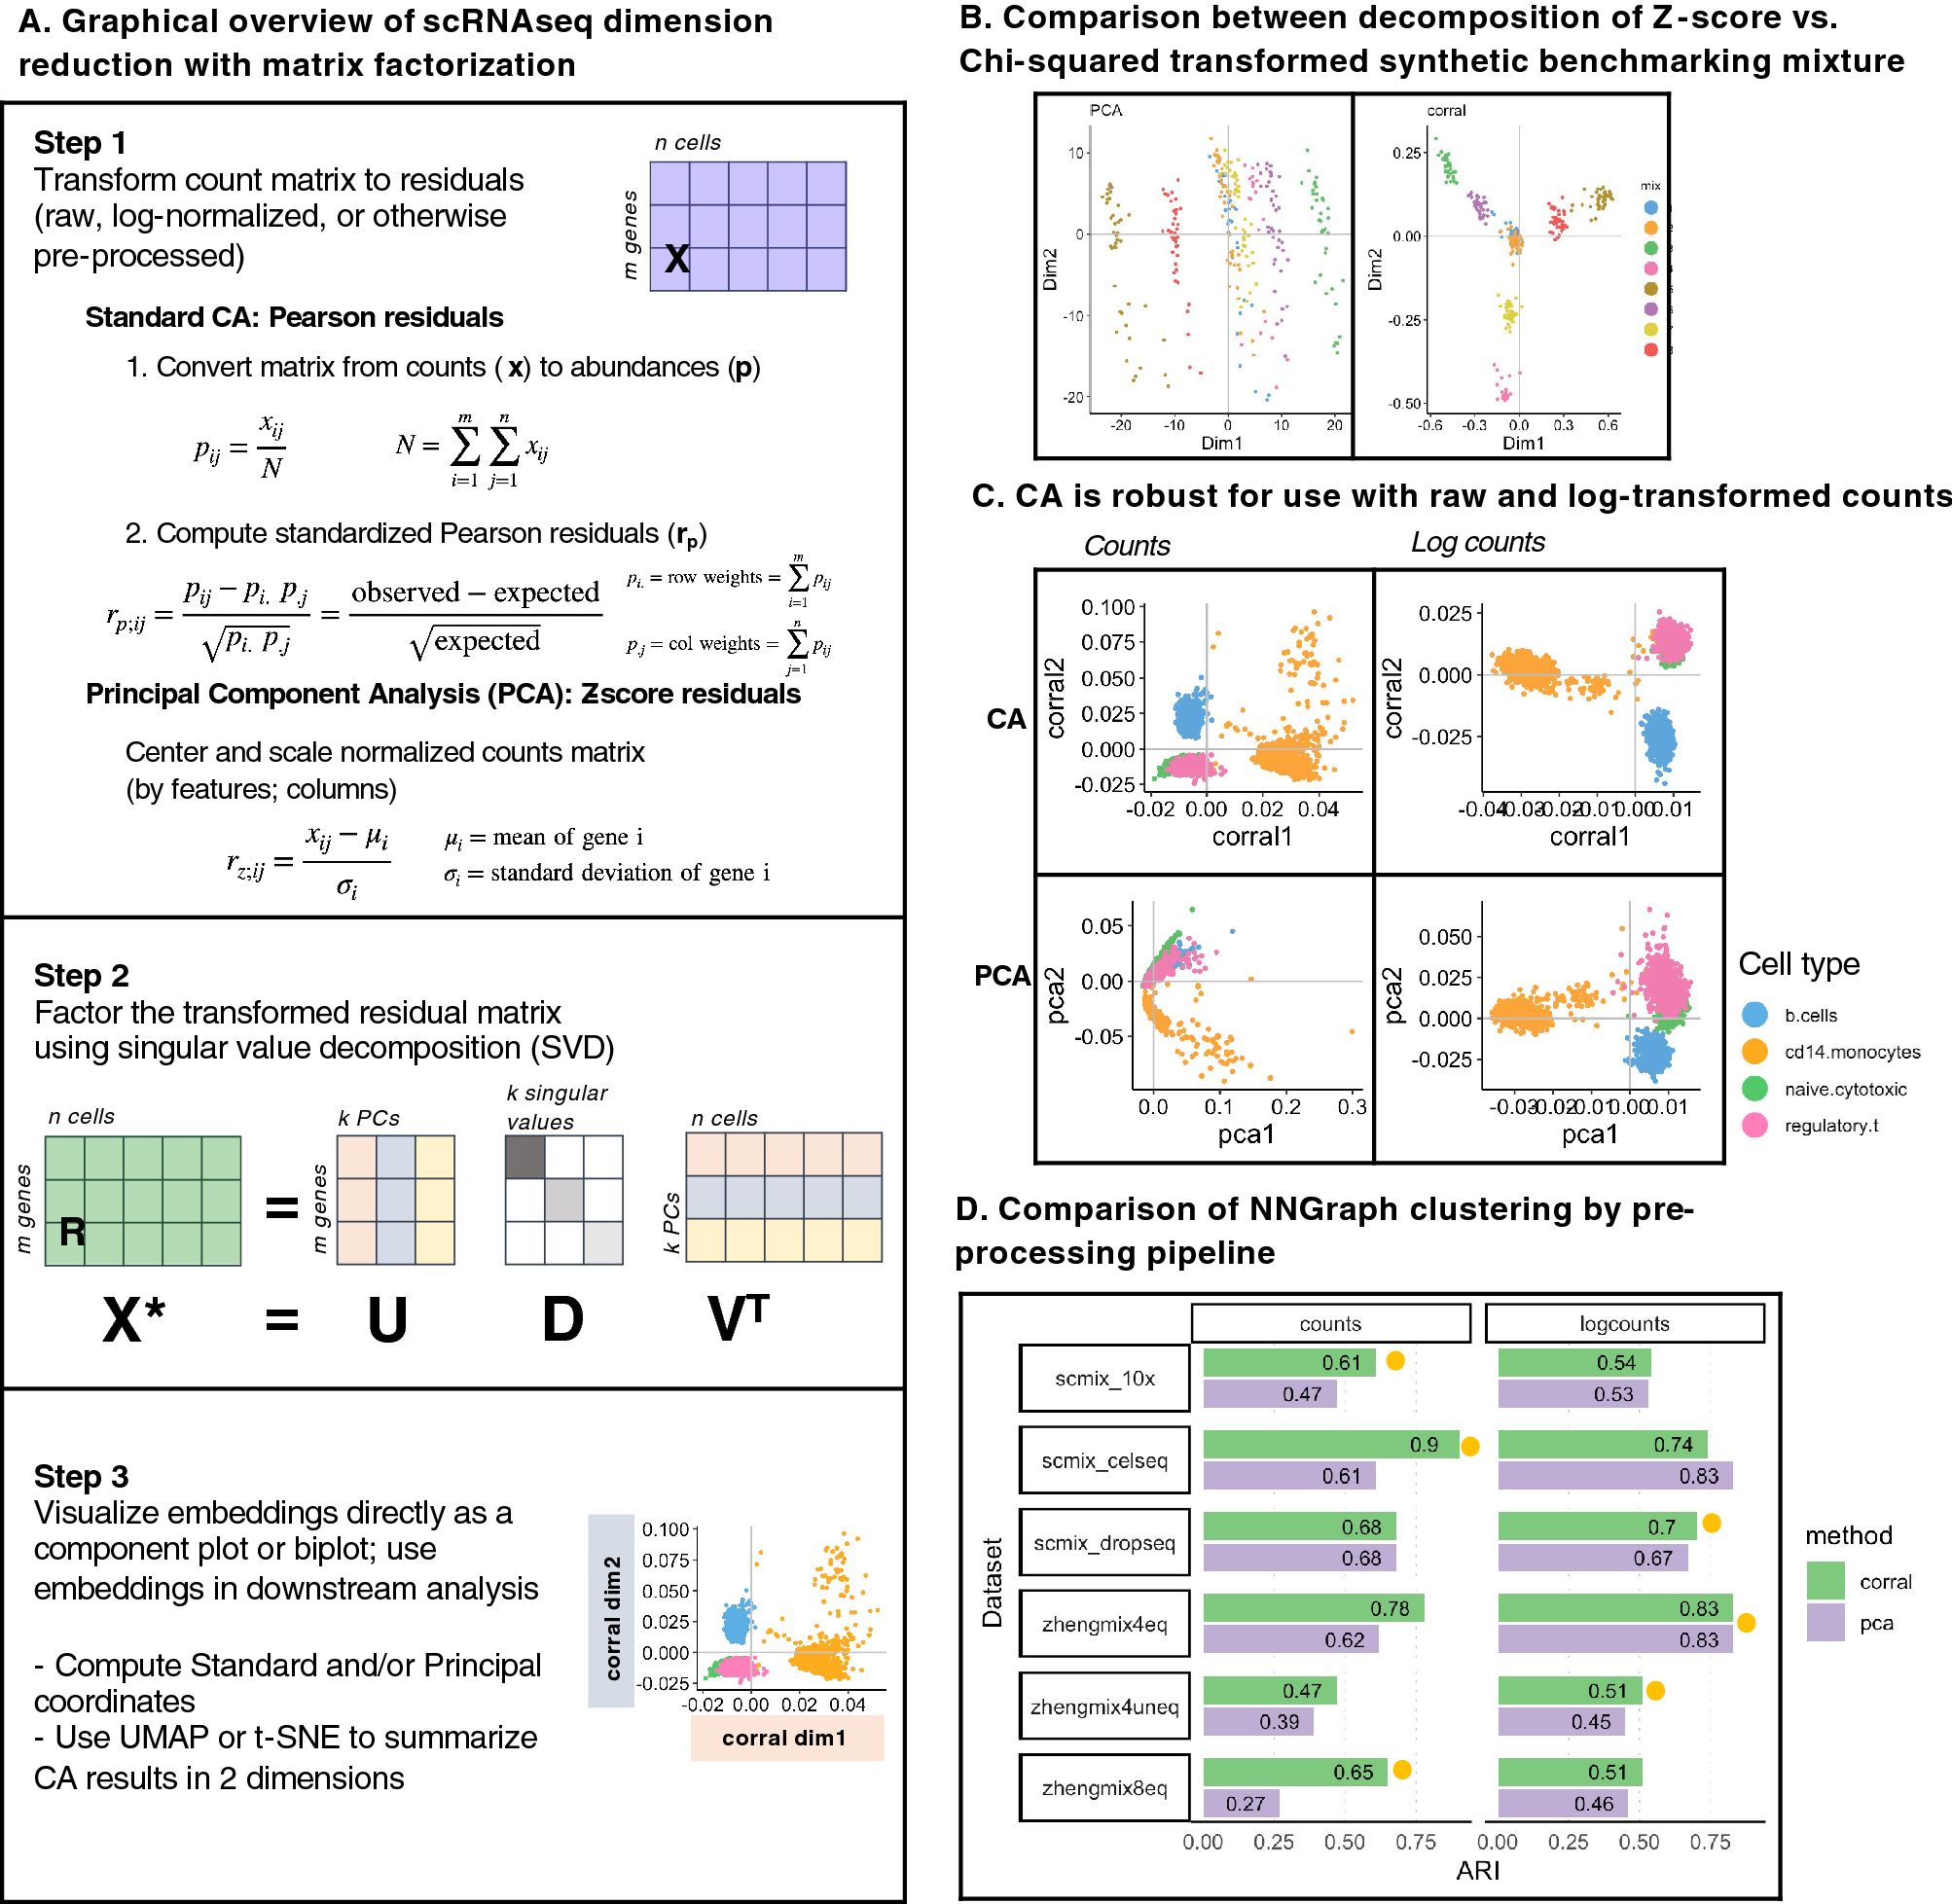
(A) Graphical overview of steps for dimension reduction with matrix factorization, including standard CA and PCA. Standard CA and PCA can be computed with singular value decomposition (SVD) of the Pearson or the Z-score residuals, respectively. (B) Plots show the first two components generated from PCA (on logcounts; left) and from CA (corral on counts; right) applied to a synthetic benchmarking mRNA mixture with 8 groups (data distributed in the CellBench R package; adapted from3). “Cells” are colored by group. CA resolves the groups into clusters, whereas standard PCA is driven by a gradient in the second component and fails to resolve the groups. (C) Plots show the first two components generated by CA (corral; top row) and PCA (bottom row) on both counts (left column) and logcounts (right column) of the Zhengmix4eq dataset, which comprises approximately 4,000 purified PBMCs in approximately equal mixtures. Cells are colored by type. CA is robust for use with counts or logcounts, whereas PCA on counts results in a horseshoe (arch) effect. (D) CA (green) and PCA (purple) were applied to counts (left column) and logcounts (right column) from six benchmarking datasets (SCMixology; Zhengmix). Embeddings from all approaches were used as input for NNGraph clustering, with performance in recovering published clusters assessed using Adjusted Rand Index (ARI). CA consistently meets or exceeds performance of PCA. Orange circles mark highest ARI achieved in each dataset.
Availability – Code and documentation are available in the corral R/Bioconductor package: https://www.bioconductor.org/packages/corral.
Hsu LL, Culhane AC. (2023) Correspondence analysis for dimension reduction, batch integration, and visualization of single-cell RNA-seq data. Sci Rep 13(1):1197. [article]


